White/Caucasian vs Cuban Disability Age 35 to 64
COMPARE
White/Caucasian
Cuban
Disability Age 35 to 64
Disability Age 35 to 64 Comparison
Whites/Caucasians
Cubans
12.6%
DISABILITY AGE 35 TO 64
0.3/ 100
METRIC RATING
266th/ 347
METRIC RANK
10.0%
DISABILITY AGE 35 TO 64
99.6/ 100
METRIC RATING
66th/ 347
METRIC RANK
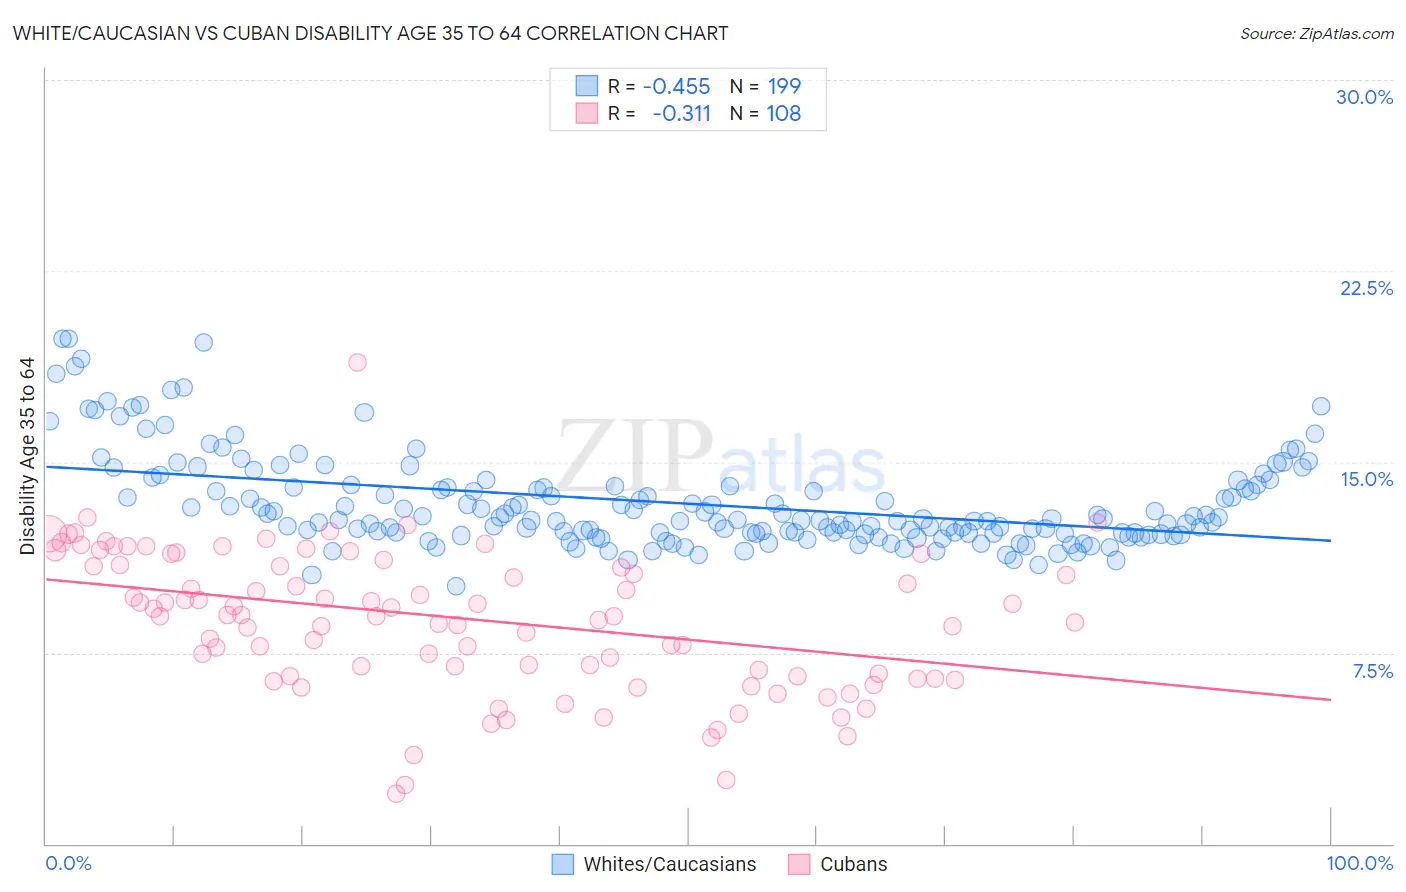
White/Caucasian vs Cuban Disability Age 35 to 64 Correlation Chart
The statistical analysis conducted on geographies consisting of 582,010,909 people shows a moderate negative correlation between the proportion of Whites/Caucasians and percentage of population with a disability between the ages 34 and 64 in the United States with a correlation coefficient (R) of -0.455 and weighted average of 12.6%. Similarly, the statistical analysis conducted on geographies consisting of 448,900,102 people shows a mild negative correlation between the proportion of Cubans and percentage of population with a disability between the ages 34 and 64 in the United States with a correlation coefficient (R) of -0.311 and weighted average of 10.0%, a difference of 25.9%.
Disability Age 35 to 64 Correlation Summary
| Measurement | White/Caucasian | Cuban |
| Minimum | 10.1% | 2.0% |
| Maximum | 19.8% | 28.5% |
| Range | 9.7% | 26.6% |
| Mean | 13.4% | 8.9% |
| Median | 12.7% | 9.0% |
| Interquartile 25% (IQ1) | 12.2% | 6.6% |
| Interquartile 75% (IQ3) | 14.0% | 10.9% |
| Interquartile Range (IQR) | 1.8% | 4.4% |
| Standard Deviation (Sample) | 1.8% | 3.4% |
| Standard Deviation (Population) | 1.8% | 3.3% |
Similar Demographics by Disability Age 35 to 64
Demographics Similar to Whites/Caucasians by Disability Age 35 to 64
In terms of disability age 35 to 64, the demographic groups most similar to Whites/Caucasians are Subsaharan African (12.6%, a difference of 0.16%), Immigrants from Dominica (12.7%, a difference of 0.34%), Spanish (12.7%, a difference of 0.44%), French (12.7%, a difference of 0.48%), and Marshallese (12.5%, a difference of 0.71%).
| Demographics | Rating | Rank | Disability Age 35 to 64 |
| English | 0.6 /100 | #259 | Tragic 12.4% |
| German Russians | 0.5 /100 | #260 | Tragic 12.5% |
| Malaysians | 0.5 /100 | #261 | Tragic 12.5% |
| Senegalese | 0.5 /100 | #262 | Tragic 12.5% |
| Immigrants | Zaire | 0.4 /100 | #263 | Tragic 12.5% |
| Immigrants | Portugal | 0.4 /100 | #264 | Tragic 12.5% |
| Marshallese | 0.4 /100 | #265 | Tragic 12.5% |
| Whites/Caucasians | 0.3 /100 | #266 | Tragic 12.6% |
| Sub-Saharan Africans | 0.2 /100 | #267 | Tragic 12.6% |
| Immigrants | Dominica | 0.2 /100 | #268 | Tragic 12.7% |
| Spanish | 0.2 /100 | #269 | Tragic 12.7% |
| French | 0.2 /100 | #270 | Tragic 12.7% |
| Nepalese | 0.1 /100 | #271 | Tragic 12.8% |
| U.S. Virgin Islanders | 0.1 /100 | #272 | Tragic 12.8% |
| Pennsylvania Germans | 0.1 /100 | #273 | Tragic 12.8% |
Demographics Similar to Cubans by Disability Age 35 to 64
In terms of disability age 35 to 64, the demographic groups most similar to Cubans are Immigrants from Poland (10.0%, a difference of 0.24%), Immigrants from Romania (10.0%, a difference of 0.32%), Immigrants from Uzbekistan (10.1%, a difference of 0.35%), Immigrants from Switzerland (10.1%, a difference of 0.46%), and Immigrants from Eastern Europe (10.1%, a difference of 0.47%).
| Demographics | Rating | Rank | Disability Age 35 to 64 |
| Immigrants | Sweden | 99.7 /100 | #59 | Exceptional 9.9% |
| Immigrants | South America | 99.7 /100 | #60 | Exceptional 9.9% |
| Immigrants | Spain | 99.7 /100 | #61 | Exceptional 10.0% |
| Eastern Europeans | 99.7 /100 | #62 | Exceptional 10.0% |
| Immigrants | Czechoslovakia | 99.7 /100 | #63 | Exceptional 10.0% |
| Immigrants | Romania | 99.7 /100 | #64 | Exceptional 10.0% |
| Immigrants | Poland | 99.6 /100 | #65 | Exceptional 10.0% |
| Cubans | 99.6 /100 | #66 | Exceptional 10.0% |
| Immigrants | Uzbekistan | 99.5 /100 | #67 | Exceptional 10.1% |
| Immigrants | Switzerland | 99.5 /100 | #68 | Exceptional 10.1% |
| Immigrants | Eastern Europe | 99.5 /100 | #69 | Exceptional 10.1% |
| Immigrants | Nicaragua | 99.5 /100 | #70 | Exceptional 10.1% |
| Immigrants | Kazakhstan | 99.5 /100 | #71 | Exceptional 10.1% |
| Immigrants | Northern Europe | 99.5 /100 | #72 | Exceptional 10.1% |
| Immigrants | France | 99.5 /100 | #73 | Exceptional 10.1% |