Taiwanese vs Cuban Disability Age 35 to 64
COMPARE
Taiwanese
Cuban
Disability Age 35 to 64
Disability Age 35 to 64 Comparison
Taiwanese
Cubans
9.8%
DISABILITY AGE 35 TO 64
99.8/ 100
METRIC RATING
53rd/ 347
METRIC RANK
10.0%
DISABILITY AGE 35 TO 64
99.6/ 100
METRIC RATING
66th/ 347
METRIC RANK
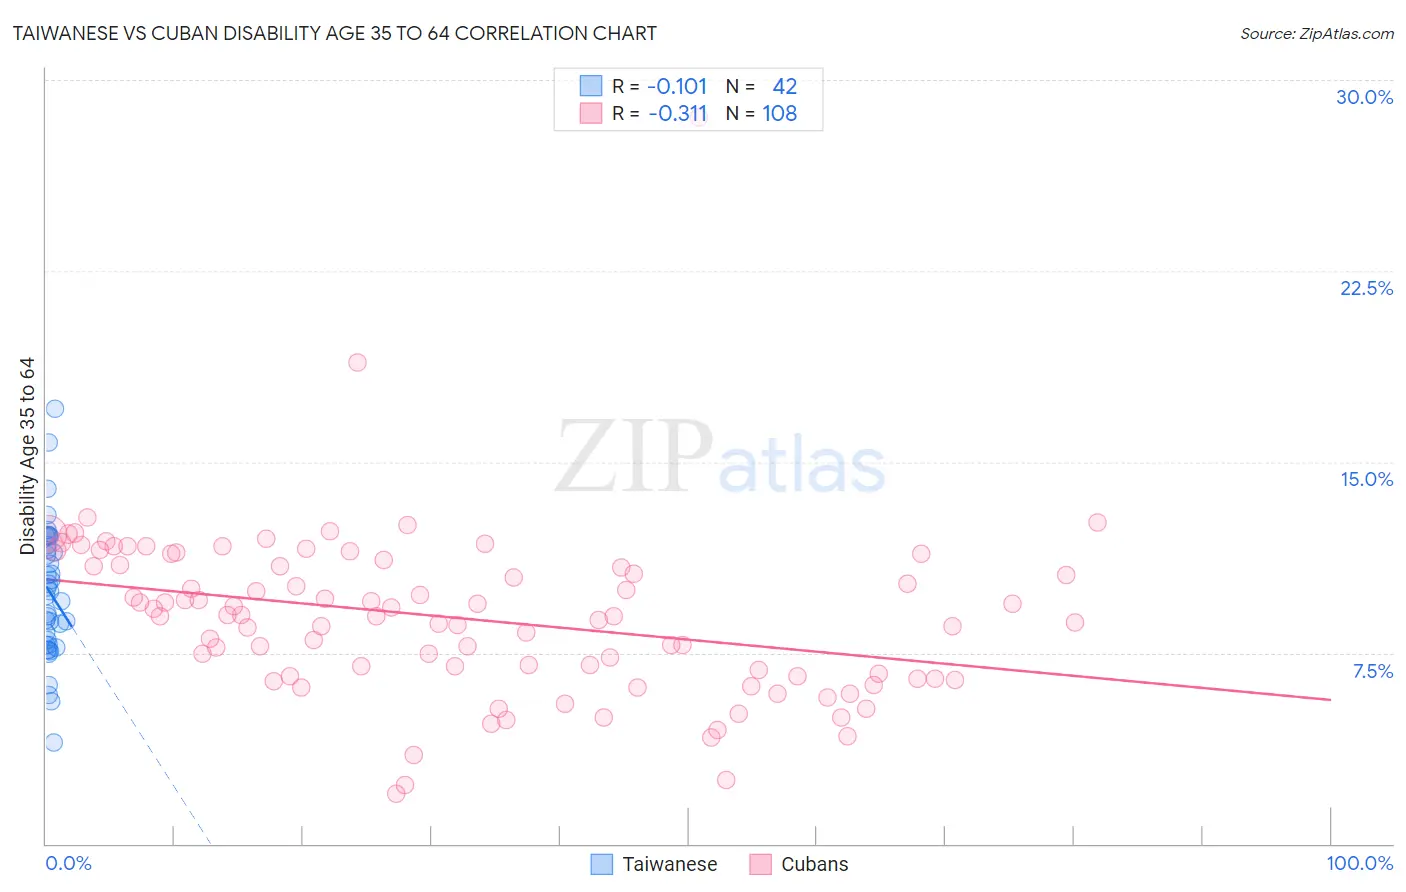
Taiwanese vs Cuban Disability Age 35 to 64 Correlation Chart
The statistical analysis conducted on geographies consisting of 31,711,988 people shows a poor negative correlation between the proportion of Taiwanese and percentage of population with a disability between the ages 34 and 64 in the United States with a correlation coefficient (R) of -0.101 and weighted average of 9.8%. Similarly, the statistical analysis conducted on geographies consisting of 448,900,102 people shows a mild negative correlation between the proportion of Cubans and percentage of population with a disability between the ages 34 and 64 in the United States with a correlation coefficient (R) of -0.311 and weighted average of 10.0%, a difference of 1.8%.
Disability Age 35 to 64 Correlation Summary
| Measurement | Taiwanese | Cuban |
| Minimum | 4.0% | 2.0% |
| Maximum | 17.1% | 28.5% |
| Range | 13.1% | 26.6% |
| Mean | 9.9% | 8.9% |
| Median | 9.8% | 9.0% |
| Interquartile 25% (IQ1) | 7.8% | 6.6% |
| Interquartile 75% (IQ3) | 11.7% | 10.9% |
| Interquartile Range (IQR) | 3.9% | 4.4% |
| Standard Deviation (Sample) | 2.6% | 3.4% |
| Standard Deviation (Population) | 2.6% | 3.3% |
Demographics Similar to Taiwanese and Cubans by Disability Age 35 to 64
In terms of disability age 35 to 64, the demographic groups most similar to Taiwanese are Immigrants from Russia (9.8%, a difference of 0.040%), Immigrants from Bulgaria (9.8%, a difference of 0.060%), Bhutanese (9.8%, a difference of 0.070%), Peruvian (9.9%, a difference of 0.10%), and Paraguayan (9.8%, a difference of 0.15%). Similarly, the demographic groups most similar to Cubans are Immigrants from Poland (10.0%, a difference of 0.24%), Immigrants from Romania (10.0%, a difference of 0.32%), Immigrants from Uzbekistan (10.1%, a difference of 0.35%), Immigrants from Switzerland (10.1%, a difference of 0.46%), and Immigrants from Eastern Europe (10.1%, a difference of 0.47%).
| Demographics | Rating | Rank | Disability Age 35 to 64 |
| Immigrants | Greece | 99.8 /100 | #49 | Exceptional 9.8% |
| Paraguayans | 99.8 /100 | #50 | Exceptional 9.8% |
| Bhutanese | 99.8 /100 | #51 | Exceptional 9.8% |
| Immigrants | Bulgaria | 99.8 /100 | #52 | Exceptional 9.8% |
| Taiwanese | 99.8 /100 | #53 | Exceptional 9.8% |
| Immigrants | Russia | 99.8 /100 | #54 | Exceptional 9.8% |
| Peruvians | 99.8 /100 | #55 | Exceptional 9.9% |
| South Americans | 99.8 /100 | #56 | Exceptional 9.9% |
| Colombians | 99.8 /100 | #57 | Exceptional 9.9% |
| Armenians | 99.8 /100 | #58 | Exceptional 9.9% |
| Immigrants | Sweden | 99.7 /100 | #59 | Exceptional 9.9% |
| Immigrants | South America | 99.7 /100 | #60 | Exceptional 9.9% |
| Immigrants | Spain | 99.7 /100 | #61 | Exceptional 10.0% |
| Eastern Europeans | 99.7 /100 | #62 | Exceptional 10.0% |
| Immigrants | Czechoslovakia | 99.7 /100 | #63 | Exceptional 10.0% |
| Immigrants | Romania | 99.7 /100 | #64 | Exceptional 10.0% |
| Immigrants | Poland | 99.6 /100 | #65 | Exceptional 10.0% |
| Cubans | 99.6 /100 | #66 | Exceptional 10.0% |
| Immigrants | Uzbekistan | 99.5 /100 | #67 | Exceptional 10.1% |
| Immigrants | Switzerland | 99.5 /100 | #68 | Exceptional 10.1% |
| Immigrants | Eastern Europe | 99.5 /100 | #69 | Exceptional 10.1% |