Black/African American vs Cuban Disability Age 35 to 64
COMPARE
Black/African American
Cuban
Disability Age 35 to 64
Disability Age 35 to 64 Comparison
Blacks/African Americans
Cubans
14.7%
DISABILITY AGE 35 TO 64
0.0/ 100
METRIC RATING
320th/ 347
METRIC RANK
10.0%
DISABILITY AGE 35 TO 64
99.6/ 100
METRIC RATING
66th/ 347
METRIC RANK
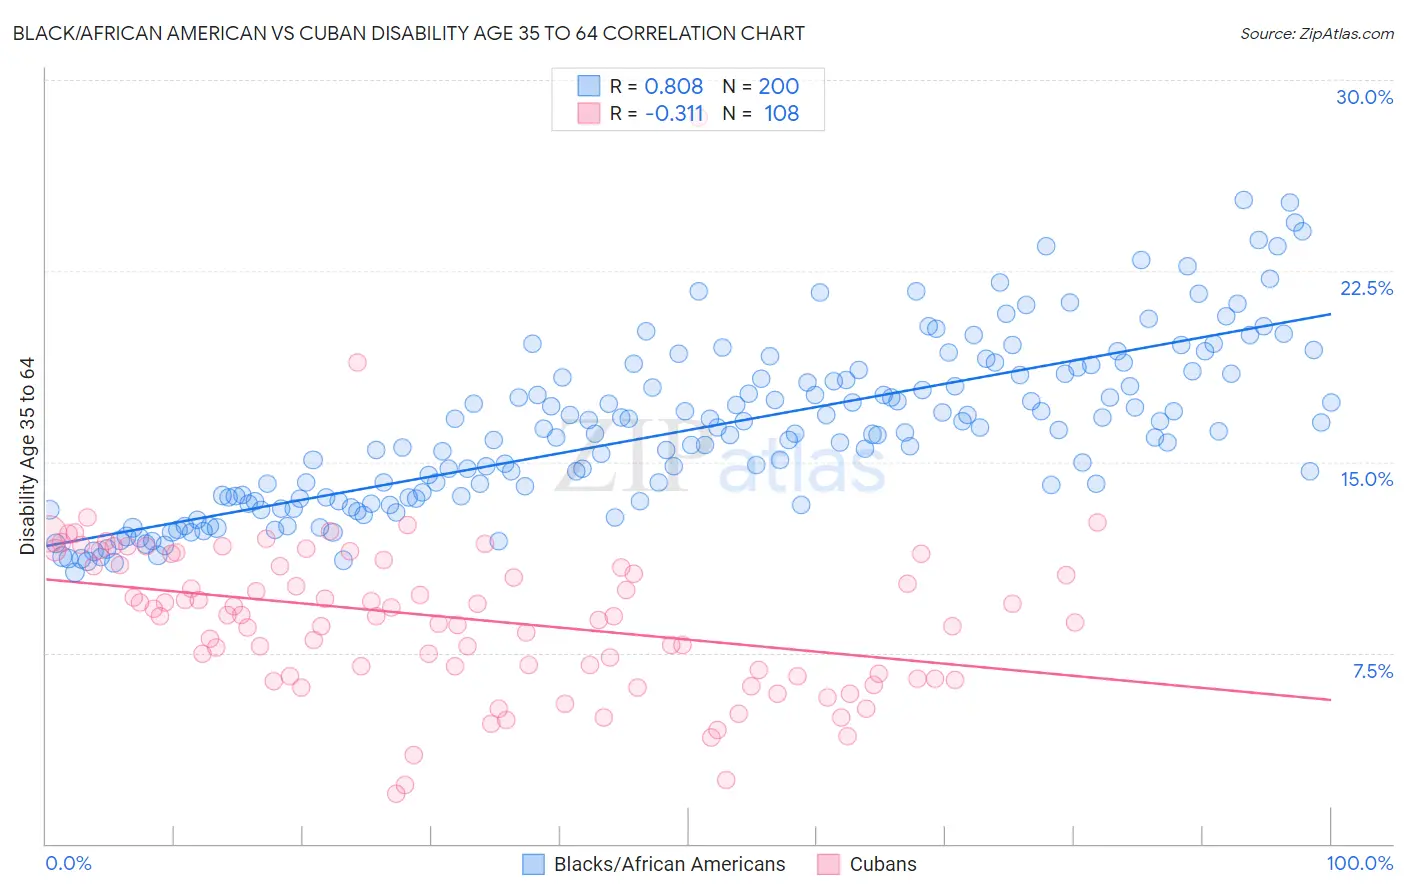
Black/African American vs Cuban Disability Age 35 to 64 Correlation Chart
The statistical analysis conducted on geographies consisting of 565,040,729 people shows a very strong positive correlation between the proportion of Blacks/African Americans and percentage of population with a disability between the ages 34 and 64 in the United States with a correlation coefficient (R) of 0.808 and weighted average of 14.7%. Similarly, the statistical analysis conducted on geographies consisting of 448,900,102 people shows a mild negative correlation between the proportion of Cubans and percentage of population with a disability between the ages 34 and 64 in the United States with a correlation coefficient (R) of -0.311 and weighted average of 10.0%, a difference of 46.8%.
Disability Age 35 to 64 Correlation Summary
| Measurement | Black/African American | Cuban |
| Minimum | 10.7% | 2.0% |
| Maximum | 25.3% | 28.5% |
| Range | 14.7% | 26.6% |
| Mean | 16.3% | 8.9% |
| Median | 16.1% | 9.0% |
| Interquartile 25% (IQ1) | 13.6% | 6.6% |
| Interquartile 75% (IQ3) | 18.4% | 10.9% |
| Interquartile Range (IQR) | 4.8% | 4.4% |
| Standard Deviation (Sample) | 3.3% | 3.4% |
| Standard Deviation (Population) | 3.3% | 3.3% |
Similar Demographics by Disability Age 35 to 64
Demographics Similar to Blacks/African Americans by Disability Age 35 to 64
In terms of disability age 35 to 64, the demographic groups most similar to Blacks/African Americans are Immigrants from Cabo Verde (14.7%, a difference of 0.15%), Comanche (14.7%, a difference of 0.26%), Potawatomi (14.8%, a difference of 0.30%), Ottawa (14.6%, a difference of 0.57%), and Crow (14.6%, a difference of 0.64%).
| Demographics | Rating | Rank | Disability Age 35 to 64 |
| Iroquois | 0.0 /100 | #313 | Tragic 14.4% |
| Shoshone | 0.0 /100 | #314 | Tragic 14.5% |
| Alaska Natives | 0.0 /100 | #315 | Tragic 14.5% |
| Osage | 0.0 /100 | #316 | Tragic 14.5% |
| Crow | 0.0 /100 | #317 | Tragic 14.6% |
| Ottawa | 0.0 /100 | #318 | Tragic 14.6% |
| Immigrants | Cabo Verde | 0.0 /100 | #319 | Tragic 14.7% |
| Blacks/African Americans | 0.0 /100 | #320 | Tragic 14.7% |
| Comanche | 0.0 /100 | #321 | Tragic 14.7% |
| Potawatomi | 0.0 /100 | #322 | Tragic 14.8% |
| Apache | 0.0 /100 | #323 | Tragic 14.9% |
| Chippewa | 0.0 /100 | #324 | Tragic 15.0% |
| Arapaho | 0.0 /100 | #325 | Tragic 15.1% |
| Natives/Alaskans | 0.0 /100 | #326 | Tragic 15.3% |
| Pueblo | 0.0 /100 | #327 | Tragic 15.3% |
Demographics Similar to Cubans by Disability Age 35 to 64
In terms of disability age 35 to 64, the demographic groups most similar to Cubans are Immigrants from Poland (10.0%, a difference of 0.24%), Immigrants from Romania (10.0%, a difference of 0.32%), Immigrants from Uzbekistan (10.1%, a difference of 0.35%), Immigrants from Switzerland (10.1%, a difference of 0.46%), and Immigrants from Eastern Europe (10.1%, a difference of 0.47%).
| Demographics | Rating | Rank | Disability Age 35 to 64 |
| Immigrants | Sweden | 99.7 /100 | #59 | Exceptional 9.9% |
| Immigrants | South America | 99.7 /100 | #60 | Exceptional 9.9% |
| Immigrants | Spain | 99.7 /100 | #61 | Exceptional 10.0% |
| Eastern Europeans | 99.7 /100 | #62 | Exceptional 10.0% |
| Immigrants | Czechoslovakia | 99.7 /100 | #63 | Exceptional 10.0% |
| Immigrants | Romania | 99.7 /100 | #64 | Exceptional 10.0% |
| Immigrants | Poland | 99.6 /100 | #65 | Exceptional 10.0% |
| Cubans | 99.6 /100 | #66 | Exceptional 10.0% |
| Immigrants | Uzbekistan | 99.5 /100 | #67 | Exceptional 10.1% |
| Immigrants | Switzerland | 99.5 /100 | #68 | Exceptional 10.1% |
| Immigrants | Eastern Europe | 99.5 /100 | #69 | Exceptional 10.1% |
| Immigrants | Nicaragua | 99.5 /100 | #70 | Exceptional 10.1% |
| Immigrants | Kazakhstan | 99.5 /100 | #71 | Exceptional 10.1% |
| Immigrants | Northern Europe | 99.5 /100 | #72 | Exceptional 10.1% |
| Immigrants | France | 99.5 /100 | #73 | Exceptional 10.1% |