White/Caucasian vs Lithuanian Disability Age 35 to 64
COMPARE
White/Caucasian
Lithuanian
Disability Age 35 to 64
Disability Age 35 to 64 Comparison
Whites/Caucasians
Lithuanians
12.6%
DISABILITY AGE 35 TO 64
0.3/ 100
METRIC RATING
266th/ 347
METRIC RANK
10.8%
DISABILITY AGE 35 TO 64
88.7/ 100
METRIC RATING
144th/ 347
METRIC RANK
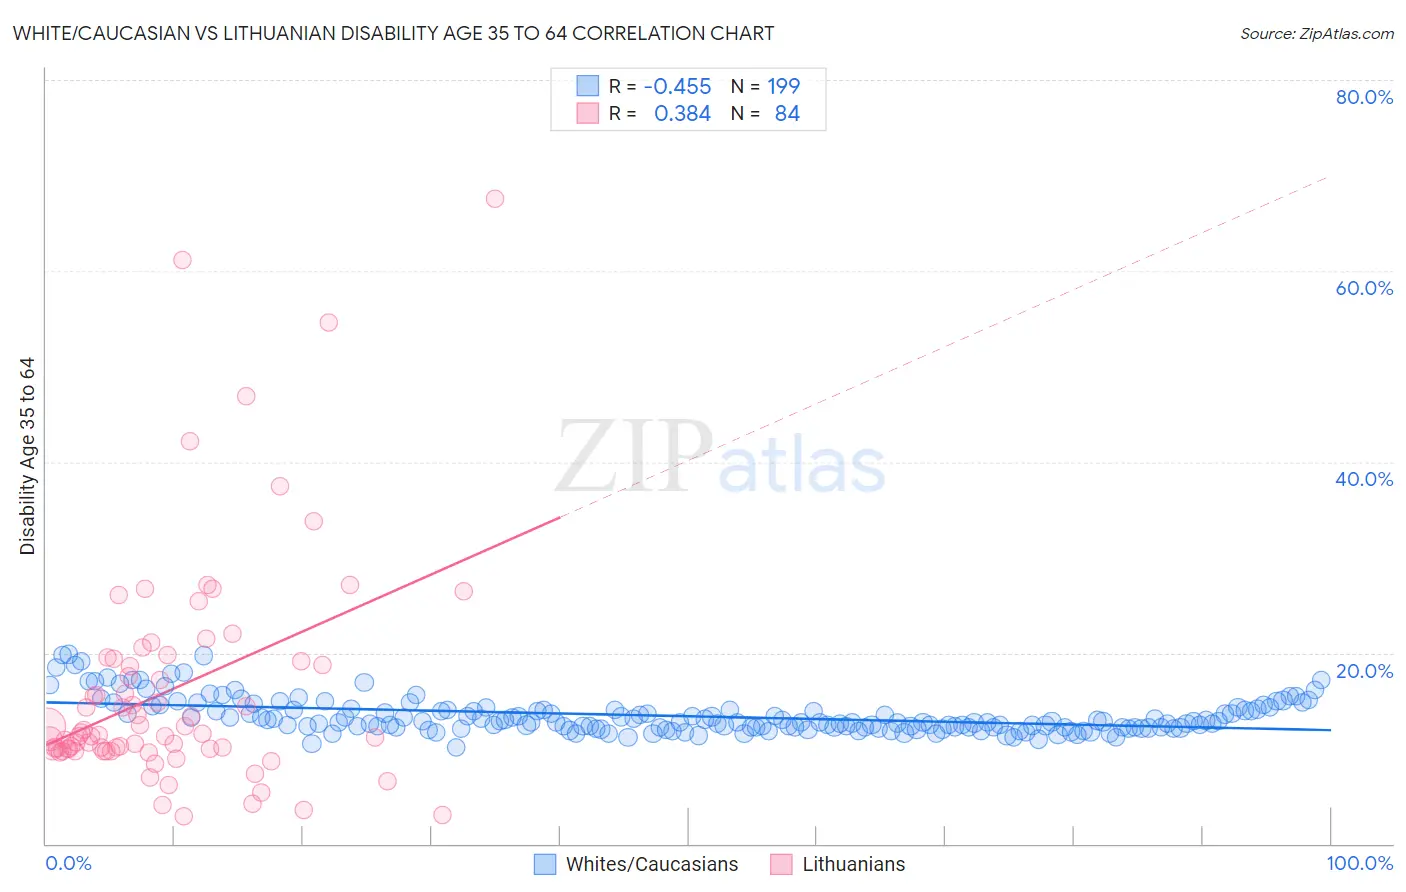
White/Caucasian vs Lithuanian Disability Age 35 to 64 Correlation Chart
The statistical analysis conducted on geographies consisting of 582,010,909 people shows a moderate negative correlation between the proportion of Whites/Caucasians and percentage of population with a disability between the ages 34 and 64 in the United States with a correlation coefficient (R) of -0.455 and weighted average of 12.6%. Similarly, the statistical analysis conducted on geographies consisting of 421,646,297 people shows a mild positive correlation between the proportion of Lithuanians and percentage of population with a disability between the ages 34 and 64 in the United States with a correlation coefficient (R) of 0.384 and weighted average of 10.8%, a difference of 16.8%.
Disability Age 35 to 64 Correlation Summary
| Measurement | White/Caucasian | Lithuanian |
| Minimum | 10.1% | 2.9% |
| Maximum | 19.8% | 67.6% |
| Range | 9.7% | 64.7% |
| Mean | 13.4% | 16.1% |
| Median | 12.7% | 11.5% |
| Interquartile 25% (IQ1) | 12.2% | 9.9% |
| Interquartile 75% (IQ3) | 14.0% | 19.2% |
| Interquartile Range (IQR) | 1.8% | 9.3% |
| Standard Deviation (Sample) | 1.8% | 12.0% |
| Standard Deviation (Population) | 1.8% | 12.0% |
Similar Demographics by Disability Age 35 to 64
Demographics Similar to Whites/Caucasians by Disability Age 35 to 64
In terms of disability age 35 to 64, the demographic groups most similar to Whites/Caucasians are Subsaharan African (12.6%, a difference of 0.16%), Immigrants from Dominica (12.7%, a difference of 0.34%), Spanish (12.7%, a difference of 0.44%), French (12.7%, a difference of 0.48%), and Marshallese (12.5%, a difference of 0.71%).
| Demographics | Rating | Rank | Disability Age 35 to 64 |
| English | 0.6 /100 | #259 | Tragic 12.4% |
| German Russians | 0.5 /100 | #260 | Tragic 12.5% |
| Malaysians | 0.5 /100 | #261 | Tragic 12.5% |
| Senegalese | 0.5 /100 | #262 | Tragic 12.5% |
| Immigrants | Zaire | 0.4 /100 | #263 | Tragic 12.5% |
| Immigrants | Portugal | 0.4 /100 | #264 | Tragic 12.5% |
| Marshallese | 0.4 /100 | #265 | Tragic 12.5% |
| Whites/Caucasians | 0.3 /100 | #266 | Tragic 12.6% |
| Sub-Saharan Africans | 0.2 /100 | #267 | Tragic 12.6% |
| Immigrants | Dominica | 0.2 /100 | #268 | Tragic 12.7% |
| Spanish | 0.2 /100 | #269 | Tragic 12.7% |
| French | 0.2 /100 | #270 | Tragic 12.7% |
| Nepalese | 0.1 /100 | #271 | Tragic 12.8% |
| U.S. Virgin Islanders | 0.1 /100 | #272 | Tragic 12.8% |
| Pennsylvania Germans | 0.1 /100 | #273 | Tragic 12.8% |
Demographics Similar to Lithuanians by Disability Age 35 to 64
In terms of disability age 35 to 64, the demographic groups most similar to Lithuanians are Sierra Leonean (10.8%, a difference of 0.21%), Immigrants from Saudi Arabia (10.8%, a difference of 0.43%), Australian (10.8%, a difference of 0.46%), Immigrants from Bangladesh (10.9%, a difference of 0.58%), and Immigrants from Scotland (10.7%, a difference of 0.59%).
| Demographics | Rating | Rank | Disability Age 35 to 64 |
| Immigrants | Costa Rica | 91.7 /100 | #137 | Exceptional 10.7% |
| Immigrants | Southern Europe | 91.5 /100 | #138 | Exceptional 10.7% |
| Costa Ricans | 91.4 /100 | #139 | Exceptional 10.7% |
| Immigrants | Scotland | 91.3 /100 | #140 | Exceptional 10.7% |
| Australians | 90.7 /100 | #141 | Exceptional 10.8% |
| Immigrants | Saudi Arabia | 90.6 /100 | #142 | Exceptional 10.8% |
| Sierra Leoneans | 89.7 /100 | #143 | Excellent 10.8% |
| Lithuanians | 88.7 /100 | #144 | Excellent 10.8% |
| Immigrants | Bangladesh | 85.6 /100 | #145 | Excellent 10.9% |
| South American Indians | 83.5 /100 | #146 | Excellent 10.9% |
| Immigrants | Eritrea | 83.4 /100 | #147 | Excellent 10.9% |
| Arabs | 82.7 /100 | #148 | Excellent 10.9% |
| Immigrants | Cameroon | 81.1 /100 | #149 | Excellent 10.9% |
| Syrians | 79.8 /100 | #150 | Good 11.0% |
| New Zealanders | 79.3 /100 | #151 | Good 11.0% |