White/Caucasian vs Alaska Native Disability Age 35 to 64
COMPARE
White/Caucasian
Alaska Native
Disability Age 35 to 64
Disability Age 35 to 64 Comparison
Whites/Caucasians
Alaska Natives
12.6%
DISABILITY AGE 35 TO 64
0.3/ 100
METRIC RATING
266th/ 347
METRIC RANK
14.5%
DISABILITY AGE 35 TO 64
0.0/ 100
METRIC RATING
315th/ 347
METRIC RANK
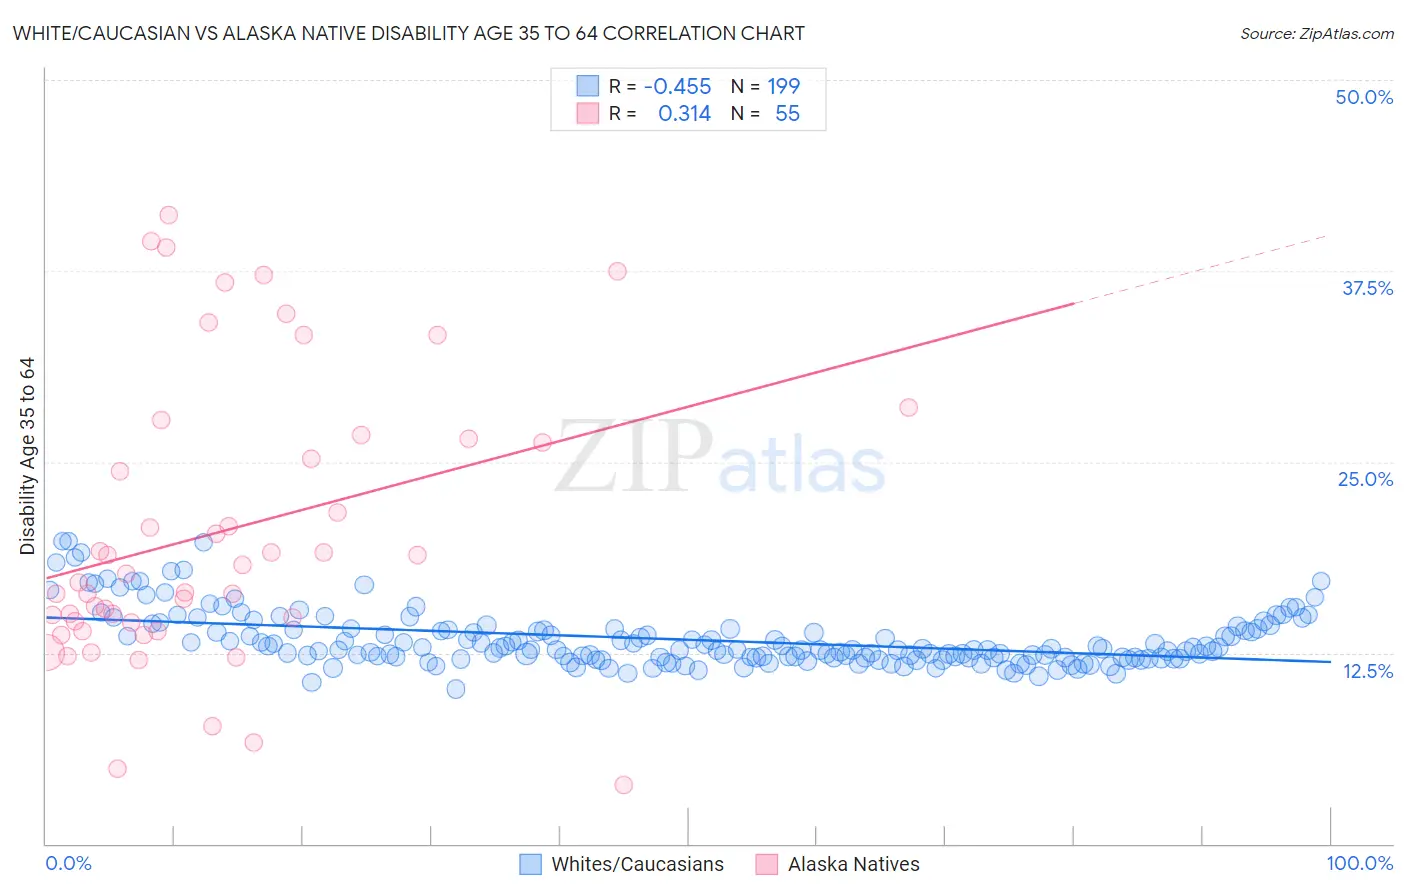
White/Caucasian vs Alaska Native Disability Age 35 to 64 Correlation Chart
The statistical analysis conducted on geographies consisting of 582,010,909 people shows a moderate negative correlation between the proportion of Whites/Caucasians and percentage of population with a disability between the ages 34 and 64 in the United States with a correlation coefficient (R) of -0.455 and weighted average of 12.6%. Similarly, the statistical analysis conducted on geographies consisting of 76,743,337 people shows a mild positive correlation between the proportion of Alaska Natives and percentage of population with a disability between the ages 34 and 64 in the United States with a correlation coefficient (R) of 0.314 and weighted average of 14.5%, a difference of 14.6%.
Disability Age 35 to 64 Correlation Summary
| Measurement | White/Caucasian | Alaska Native |
| Minimum | 10.1% | 3.8% |
| Maximum | 19.8% | 41.2% |
| Range | 9.7% | 37.3% |
| Mean | 13.4% | 20.5% |
| Median | 12.7% | 17.7% |
| Interquartile 25% (IQ1) | 12.2% | 14.5% |
| Interquartile 75% (IQ3) | 14.0% | 26.5% |
| Interquartile Range (IQR) | 1.8% | 12.1% |
| Standard Deviation (Sample) | 1.8% | 9.3% |
| Standard Deviation (Population) | 1.8% | 9.2% |
Similar Demographics by Disability Age 35 to 64
Demographics Similar to Whites/Caucasians by Disability Age 35 to 64
In terms of disability age 35 to 64, the demographic groups most similar to Whites/Caucasians are Subsaharan African (12.6%, a difference of 0.16%), Immigrants from Dominica (12.7%, a difference of 0.34%), Spanish (12.7%, a difference of 0.44%), French (12.7%, a difference of 0.48%), and Marshallese (12.5%, a difference of 0.71%).
| Demographics | Rating | Rank | Disability Age 35 to 64 |
| English | 0.6 /100 | #259 | Tragic 12.4% |
| German Russians | 0.5 /100 | #260 | Tragic 12.5% |
| Malaysians | 0.5 /100 | #261 | Tragic 12.5% |
| Senegalese | 0.5 /100 | #262 | Tragic 12.5% |
| Immigrants | Zaire | 0.4 /100 | #263 | Tragic 12.5% |
| Immigrants | Portugal | 0.4 /100 | #264 | Tragic 12.5% |
| Marshallese | 0.4 /100 | #265 | Tragic 12.5% |
| Whites/Caucasians | 0.3 /100 | #266 | Tragic 12.6% |
| Sub-Saharan Africans | 0.2 /100 | #267 | Tragic 12.6% |
| Immigrants | Dominica | 0.2 /100 | #268 | Tragic 12.7% |
| Spanish | 0.2 /100 | #269 | Tragic 12.7% |
| French | 0.2 /100 | #270 | Tragic 12.7% |
| Nepalese | 0.1 /100 | #271 | Tragic 12.8% |
| U.S. Virgin Islanders | 0.1 /100 | #272 | Tragic 12.8% |
| Pennsylvania Germans | 0.1 /100 | #273 | Tragic 12.8% |
Demographics Similar to Alaska Natives by Disability Age 35 to 64
In terms of disability age 35 to 64, the demographic groups most similar to Alaska Natives are Shoshone (14.5%, a difference of 0.020%), Osage (14.5%, a difference of 0.19%), Iroquois (14.4%, a difference of 0.77%), Crow (14.6%, a difference of 1.1%), and Ottawa (14.6%, a difference of 1.1%).
| Demographics | Rating | Rank | Disability Age 35 to 64 |
| Inupiat | 0.0 /100 | #308 | Tragic 14.1% |
| Cree | 0.0 /100 | #309 | Tragic 14.1% |
| Cape Verdeans | 0.0 /100 | #310 | Tragic 14.1% |
| Immigrants | Azores | 0.0 /100 | #311 | Tragic 14.3% |
| Paiute | 0.0 /100 | #312 | Tragic 14.3% |
| Iroquois | 0.0 /100 | #313 | Tragic 14.4% |
| Shoshone | 0.0 /100 | #314 | Tragic 14.5% |
| Alaska Natives | 0.0 /100 | #315 | Tragic 14.5% |
| Osage | 0.0 /100 | #316 | Tragic 14.5% |
| Crow | 0.0 /100 | #317 | Tragic 14.6% |
| Ottawa | 0.0 /100 | #318 | Tragic 14.6% |
| Immigrants | Cabo Verde | 0.0 /100 | #319 | Tragic 14.7% |
| Blacks/African Americans | 0.0 /100 | #320 | Tragic 14.7% |
| Comanche | 0.0 /100 | #321 | Tragic 14.7% |
| Potawatomi | 0.0 /100 | #322 | Tragic 14.8% |