Immigrants from the Azores vs Cuban Disability Age 35 to 64
COMPARE
Immigrants from the Azores
Cuban
Disability Age 35 to 64
Disability Age 35 to 64 Comparison
Immigrants from the Azores
Cubans
14.3%
DISABILITY AGE 35 TO 64
0.0/ 100
METRIC RATING
311th/ 347
METRIC RANK
10.0%
DISABILITY AGE 35 TO 64
99.6/ 100
METRIC RATING
66th/ 347
METRIC RANK
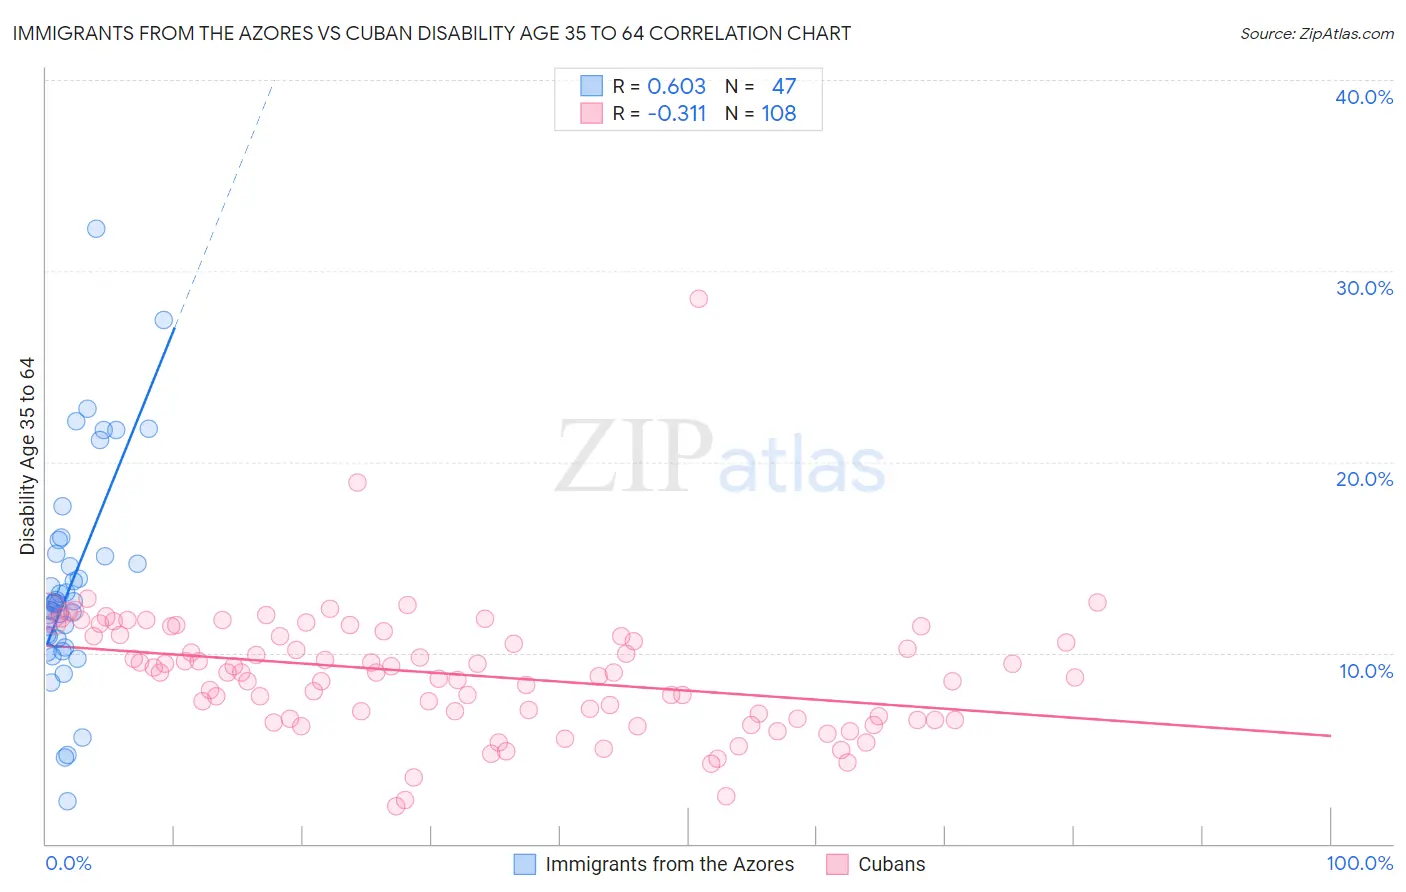
Immigrants from the Azores vs Cuban Disability Age 35 to 64 Correlation Chart
The statistical analysis conducted on geographies consisting of 46,256,915 people shows a significant positive correlation between the proportion of Immigrants from the Azores and percentage of population with a disability between the ages 34 and 64 in the United States with a correlation coefficient (R) of 0.603 and weighted average of 14.3%. Similarly, the statistical analysis conducted on geographies consisting of 448,900,102 people shows a mild negative correlation between the proportion of Cubans and percentage of population with a disability between the ages 34 and 64 in the United States with a correlation coefficient (R) of -0.311 and weighted average of 10.0%, a difference of 42.3%.
Disability Age 35 to 64 Correlation Summary
| Measurement | Immigrants from the Azores | Cuban |
| Minimum | 2.2% | 2.0% |
| Maximum | 32.2% | 28.5% |
| Range | 30.0% | 26.6% |
| Mean | 13.7% | 8.9% |
| Median | 12.6% | 9.0% |
| Interquartile 25% (IQ1) | 10.7% | 6.6% |
| Interquartile 75% (IQ3) | 15.2% | 10.9% |
| Interquartile Range (IQR) | 4.5% | 4.4% |
| Standard Deviation (Sample) | 5.7% | 3.4% |
| Standard Deviation (Population) | 5.7% | 3.3% |
Similar Demographics by Disability Age 35 to 64
Demographics Similar to Immigrants from the Azores by Disability Age 35 to 64
In terms of disability age 35 to 64, the demographic groups most similar to Immigrants from the Azores are Paiute (14.3%, a difference of 0.15%), Iroquois (14.4%, a difference of 0.58%), Cape Verdean (14.1%, a difference of 0.92%), Shoshone (14.5%, a difference of 1.3%), and Alaska Native (14.5%, a difference of 1.4%).
| Demographics | Rating | Rank | Disability Age 35 to 64 |
| Hopi | 0.0 /100 | #304 | Tragic 13.9% |
| Americans | 0.0 /100 | #305 | Tragic 13.9% |
| Immigrants | Yemen | 0.0 /100 | #306 | Tragic 14.0% |
| Blackfeet | 0.0 /100 | #307 | Tragic 14.1% |
| Inupiat | 0.0 /100 | #308 | Tragic 14.1% |
| Cree | 0.0 /100 | #309 | Tragic 14.1% |
| Cape Verdeans | 0.0 /100 | #310 | Tragic 14.1% |
| Immigrants | Azores | 0.0 /100 | #311 | Tragic 14.3% |
| Paiute | 0.0 /100 | #312 | Tragic 14.3% |
| Iroquois | 0.0 /100 | #313 | Tragic 14.4% |
| Shoshone | 0.0 /100 | #314 | Tragic 14.5% |
| Alaska Natives | 0.0 /100 | #315 | Tragic 14.5% |
| Osage | 0.0 /100 | #316 | Tragic 14.5% |
| Crow | 0.0 /100 | #317 | Tragic 14.6% |
| Ottawa | 0.0 /100 | #318 | Tragic 14.6% |
Demographics Similar to Cubans by Disability Age 35 to 64
In terms of disability age 35 to 64, the demographic groups most similar to Cubans are Immigrants from Poland (10.0%, a difference of 0.24%), Immigrants from Romania (10.0%, a difference of 0.32%), Immigrants from Uzbekistan (10.1%, a difference of 0.35%), Immigrants from Switzerland (10.1%, a difference of 0.46%), and Immigrants from Eastern Europe (10.1%, a difference of 0.47%).
| Demographics | Rating | Rank | Disability Age 35 to 64 |
| Immigrants | Sweden | 99.7 /100 | #59 | Exceptional 9.9% |
| Immigrants | South America | 99.7 /100 | #60 | Exceptional 9.9% |
| Immigrants | Spain | 99.7 /100 | #61 | Exceptional 10.0% |
| Eastern Europeans | 99.7 /100 | #62 | Exceptional 10.0% |
| Immigrants | Czechoslovakia | 99.7 /100 | #63 | Exceptional 10.0% |
| Immigrants | Romania | 99.7 /100 | #64 | Exceptional 10.0% |
| Immigrants | Poland | 99.6 /100 | #65 | Exceptional 10.0% |
| Cubans | 99.6 /100 | #66 | Exceptional 10.0% |
| Immigrants | Uzbekistan | 99.5 /100 | #67 | Exceptional 10.1% |
| Immigrants | Switzerland | 99.5 /100 | #68 | Exceptional 10.1% |
| Immigrants | Eastern Europe | 99.5 /100 | #69 | Exceptional 10.1% |
| Immigrants | Nicaragua | 99.5 /100 | #70 | Exceptional 10.1% |
| Immigrants | Kazakhstan | 99.5 /100 | #71 | Exceptional 10.1% |
| Immigrants | Northern Europe | 99.5 /100 | #72 | Exceptional 10.1% |
| Immigrants | France | 99.5 /100 | #73 | Exceptional 10.1% |