White/Caucasian vs Czech Disability Age 35 to 64
COMPARE
White/Caucasian
Czech
Disability Age 35 to 64
Disability Age 35 to 64 Comparison
Whites/Caucasians
Czechs
12.6%
DISABILITY AGE 35 TO 64
0.3/ 100
METRIC RATING
266th/ 347
METRIC RANK
11.3%
DISABILITY AGE 35 TO 64
47.9/ 100
METRIC RATING
175th/ 347
METRIC RANK
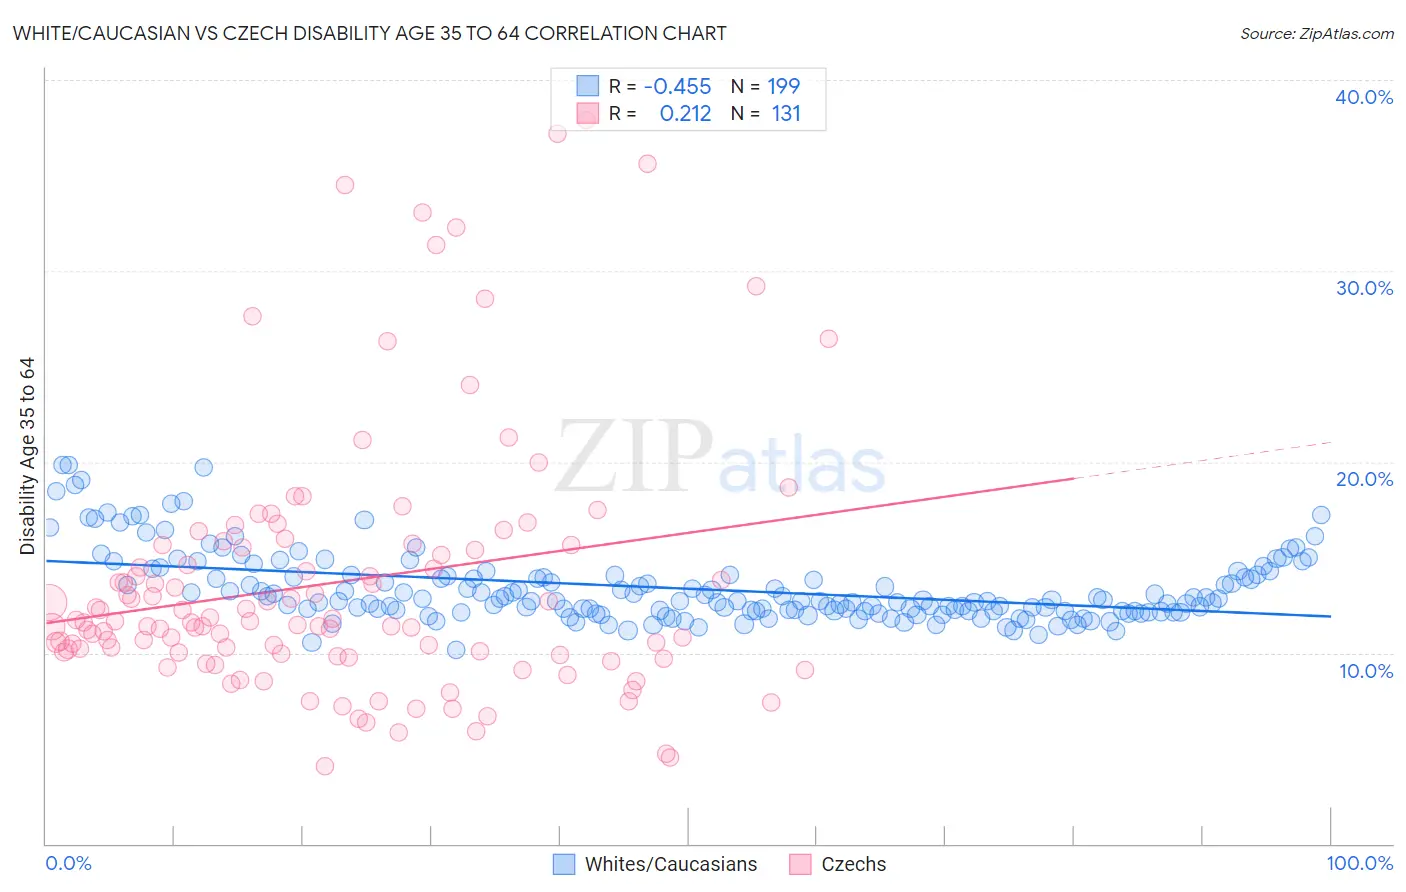
White/Caucasian vs Czech Disability Age 35 to 64 Correlation Chart
The statistical analysis conducted on geographies consisting of 582,010,909 people shows a moderate negative correlation between the proportion of Whites/Caucasians and percentage of population with a disability between the ages 34 and 64 in the United States with a correlation coefficient (R) of -0.455 and weighted average of 12.6%. Similarly, the statistical analysis conducted on geographies consisting of 484,309,618 people shows a weak positive correlation between the proportion of Czechs and percentage of population with a disability between the ages 34 and 64 in the United States with a correlation coefficient (R) of 0.212 and weighted average of 11.3%, a difference of 11.8%.
Disability Age 35 to 64 Correlation Summary
| Measurement | White/Caucasian | Czech |
| Minimum | 10.1% | 4.1% |
| Maximum | 19.8% | 37.9% |
| Range | 9.7% | 33.8% |
| Mean | 13.4% | 13.7% |
| Median | 12.7% | 11.6% |
| Interquartile 25% (IQ1) | 12.2% | 9.9% |
| Interquartile 75% (IQ3) | 14.0% | 15.6% |
| Interquartile Range (IQR) | 1.8% | 5.7% |
| Standard Deviation (Sample) | 1.8% | 6.8% |
| Standard Deviation (Population) | 1.8% | 6.8% |
Similar Demographics by Disability Age 35 to 64
Demographics Similar to Whites/Caucasians by Disability Age 35 to 64
In terms of disability age 35 to 64, the demographic groups most similar to Whites/Caucasians are Subsaharan African (12.6%, a difference of 0.16%), Immigrants from Dominica (12.7%, a difference of 0.34%), Spanish (12.7%, a difference of 0.44%), French (12.7%, a difference of 0.48%), and Marshallese (12.5%, a difference of 0.71%).
| Demographics | Rating | Rank | Disability Age 35 to 64 |
| English | 0.6 /100 | #259 | Tragic 12.4% |
| German Russians | 0.5 /100 | #260 | Tragic 12.5% |
| Malaysians | 0.5 /100 | #261 | Tragic 12.5% |
| Senegalese | 0.5 /100 | #262 | Tragic 12.5% |
| Immigrants | Zaire | 0.4 /100 | #263 | Tragic 12.5% |
| Immigrants | Portugal | 0.4 /100 | #264 | Tragic 12.5% |
| Marshallese | 0.4 /100 | #265 | Tragic 12.5% |
| Whites/Caucasians | 0.3 /100 | #266 | Tragic 12.6% |
| Sub-Saharan Africans | 0.2 /100 | #267 | Tragic 12.6% |
| Immigrants | Dominica | 0.2 /100 | #268 | Tragic 12.7% |
| Spanish | 0.2 /100 | #269 | Tragic 12.7% |
| French | 0.2 /100 | #270 | Tragic 12.7% |
| Nepalese | 0.1 /100 | #271 | Tragic 12.8% |
| U.S. Virgin Islanders | 0.1 /100 | #272 | Tragic 12.8% |
| Pennsylvania Germans | 0.1 /100 | #273 | Tragic 12.8% |
Demographics Similar to Czechs by Disability Age 35 to 64
In terms of disability age 35 to 64, the demographic groups most similar to Czechs are Immigrants from Fiji (11.3%, a difference of 0.17%), Lebanese (11.3%, a difference of 0.31%), Ugandan (11.3%, a difference of 0.34%), Immigrants from Eastern Africa (11.3%, a difference of 0.46%), and Polish (11.3%, a difference of 0.48%).
| Demographics | Rating | Rank | Disability Age 35 to 64 |
| Central Americans | 59.1 /100 | #168 | Average 11.2% |
| Haitians | 59.0 /100 | #169 | Average 11.2% |
| Immigrants | Uganda | 58.0 /100 | #170 | Average 11.2% |
| Immigrants | Trinidad and Tobago | 55.9 /100 | #171 | Average 11.2% |
| Italians | 55.6 /100 | #172 | Average 11.2% |
| Lebanese | 51.8 /100 | #173 | Average 11.3% |
| Immigrants | Fiji | 50.0 /100 | #174 | Average 11.3% |
| Czechs | 47.9 /100 | #175 | Average 11.3% |
| Ugandans | 43.7 /100 | #176 | Average 11.3% |
| Immigrants | Eastern Africa | 42.2 /100 | #177 | Average 11.3% |
| Poles | 42.0 /100 | #178 | Average 11.3% |
| Immigrants | Barbados | 41.6 /100 | #179 | Average 11.3% |
| Immigrants | Caribbean | 41.5 /100 | #180 | Average 11.3% |
| Trinidadians and Tobagonians | 40.8 /100 | #181 | Average 11.4% |
| Icelanders | 39.7 /100 | #182 | Fair 11.4% |