Armenian vs Cuban Disability Age 35 to 64
COMPARE
Armenian
Cuban
Disability Age 35 to 64
Disability Age 35 to 64 Comparison
Armenians
Cubans
9.9%
DISABILITY AGE 35 TO 64
99.8/ 100
METRIC RATING
58th/ 347
METRIC RANK
10.0%
DISABILITY AGE 35 TO 64
99.6/ 100
METRIC RATING
66th/ 347
METRIC RANK
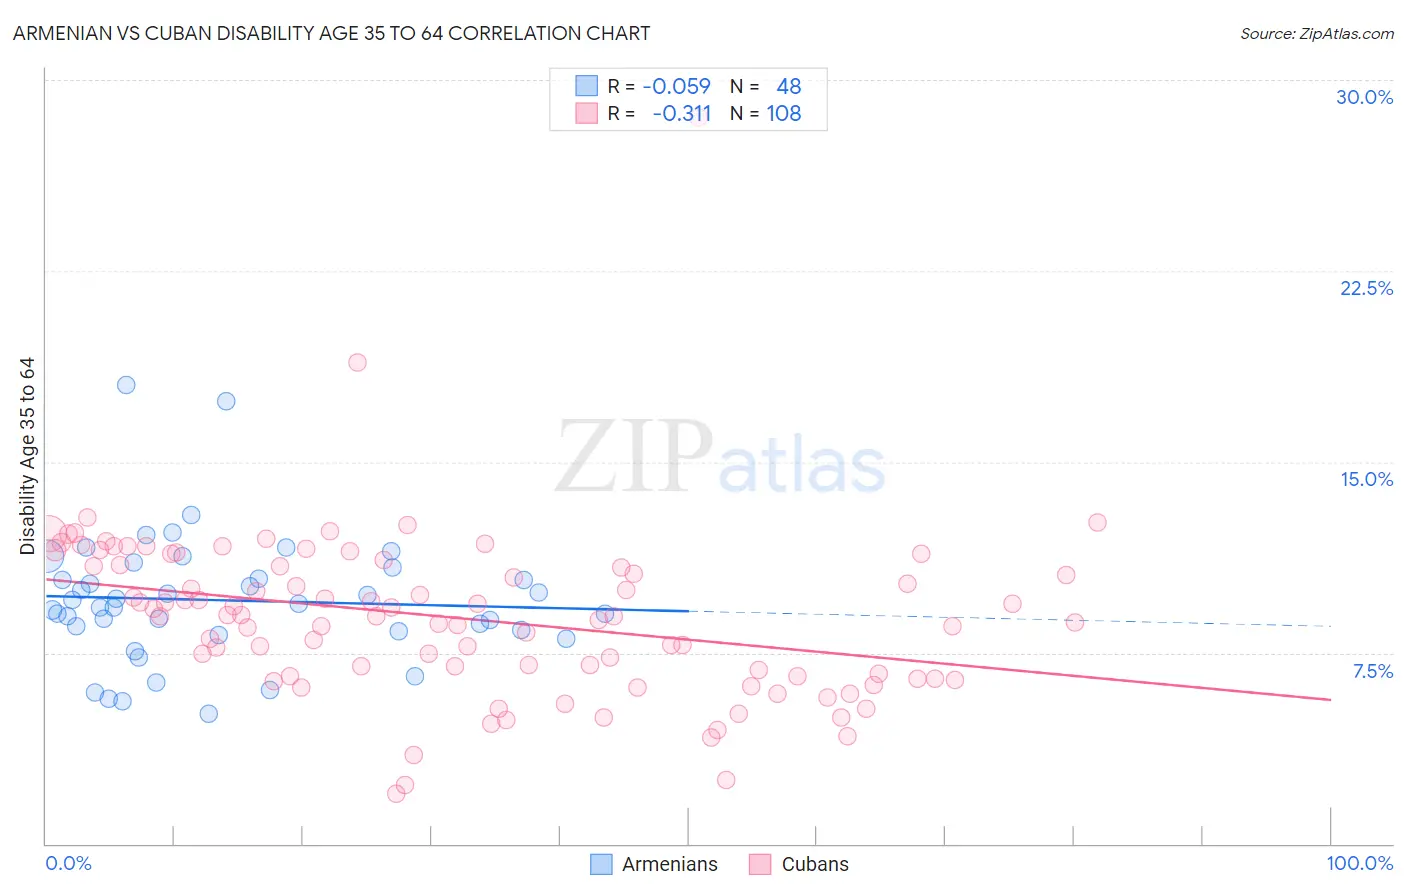
Armenian vs Cuban Disability Age 35 to 64 Correlation Chart
The statistical analysis conducted on geographies consisting of 310,760,259 people shows a slight negative correlation between the proportion of Armenians and percentage of population with a disability between the ages 34 and 64 in the United States with a correlation coefficient (R) of -0.059 and weighted average of 9.9%. Similarly, the statistical analysis conducted on geographies consisting of 448,900,102 people shows a mild negative correlation between the proportion of Cubans and percentage of population with a disability between the ages 34 and 64 in the United States with a correlation coefficient (R) of -0.311 and weighted average of 10.0%, a difference of 1.4%.
Disability Age 35 to 64 Correlation Summary
| Measurement | Armenian | Cuban |
| Minimum | 5.1% | 2.0% |
| Maximum | 18.0% | 28.5% |
| Range | 12.9% | 26.6% |
| Mean | 9.6% | 8.9% |
| Median | 9.4% | 9.0% |
| Interquartile 25% (IQ1) | 8.4% | 6.6% |
| Interquartile 75% (IQ3) | 10.6% | 10.9% |
| Interquartile Range (IQR) | 2.3% | 4.4% |
| Standard Deviation (Sample) | 2.5% | 3.4% |
| Standard Deviation (Population) | 2.5% | 3.3% |
Demographics Similar to Armenians and Cubans by Disability Age 35 to 64
In terms of disability age 35 to 64, the demographic groups most similar to Armenians are Colombian (9.9%, a difference of 0.10%), South American (9.9%, a difference of 0.12%), Immigrants from Sweden (9.9%, a difference of 0.30%), Peruvian (9.9%, a difference of 0.34%), and Immigrants from Russia (9.8%, a difference of 0.40%). Similarly, the demographic groups most similar to Cubans are Immigrants from Poland (10.0%, a difference of 0.24%), Immigrants from Romania (10.0%, a difference of 0.32%), Immigrants from Uzbekistan (10.1%, a difference of 0.35%), Immigrants from Switzerland (10.1%, a difference of 0.46%), and Immigrants from Eastern Europe (10.1%, a difference of 0.47%).
| Demographics | Rating | Rank | Disability Age 35 to 64 |
| Immigrants | Bulgaria | 99.8 /100 | #52 | Exceptional 9.8% |
| Taiwanese | 99.8 /100 | #53 | Exceptional 9.8% |
| Immigrants | Russia | 99.8 /100 | #54 | Exceptional 9.8% |
| Peruvians | 99.8 /100 | #55 | Exceptional 9.9% |
| South Americans | 99.8 /100 | #56 | Exceptional 9.9% |
| Colombians | 99.8 /100 | #57 | Exceptional 9.9% |
| Armenians | 99.8 /100 | #58 | Exceptional 9.9% |
| Immigrants | Sweden | 99.7 /100 | #59 | Exceptional 9.9% |
| Immigrants | South America | 99.7 /100 | #60 | Exceptional 9.9% |
| Immigrants | Spain | 99.7 /100 | #61 | Exceptional 10.0% |
| Eastern Europeans | 99.7 /100 | #62 | Exceptional 10.0% |
| Immigrants | Czechoslovakia | 99.7 /100 | #63 | Exceptional 10.0% |
| Immigrants | Romania | 99.7 /100 | #64 | Exceptional 10.0% |
| Immigrants | Poland | 99.6 /100 | #65 | Exceptional 10.0% |
| Cubans | 99.6 /100 | #66 | Exceptional 10.0% |
| Immigrants | Uzbekistan | 99.5 /100 | #67 | Exceptional 10.1% |
| Immigrants | Switzerland | 99.5 /100 | #68 | Exceptional 10.1% |
| Immigrants | Eastern Europe | 99.5 /100 | #69 | Exceptional 10.1% |
| Immigrants | Nicaragua | 99.5 /100 | #70 | Exceptional 10.1% |
| Immigrants | Kazakhstan | 99.5 /100 | #71 | Exceptional 10.1% |
| Immigrants | Northern Europe | 99.5 /100 | #72 | Exceptional 10.1% |