Immigrants from Cabo Verde vs Bangladeshi Disability Age 65 to 74
COMPARE
Immigrants from Cabo Verde
Bangladeshi
Disability Age 65 to 74
Disability Age 65 to 74 Comparison
Immigrants from Cabo Verde
Bangladeshis
26.3%
DISABILITY AGE 65 TO 74
0.0/ 100
METRIC RATING
290th/ 347
METRIC RANK
26.8%
DISABILITY AGE 65 TO 74
0.0/ 100
METRIC RATING
296th/ 347
METRIC RANK
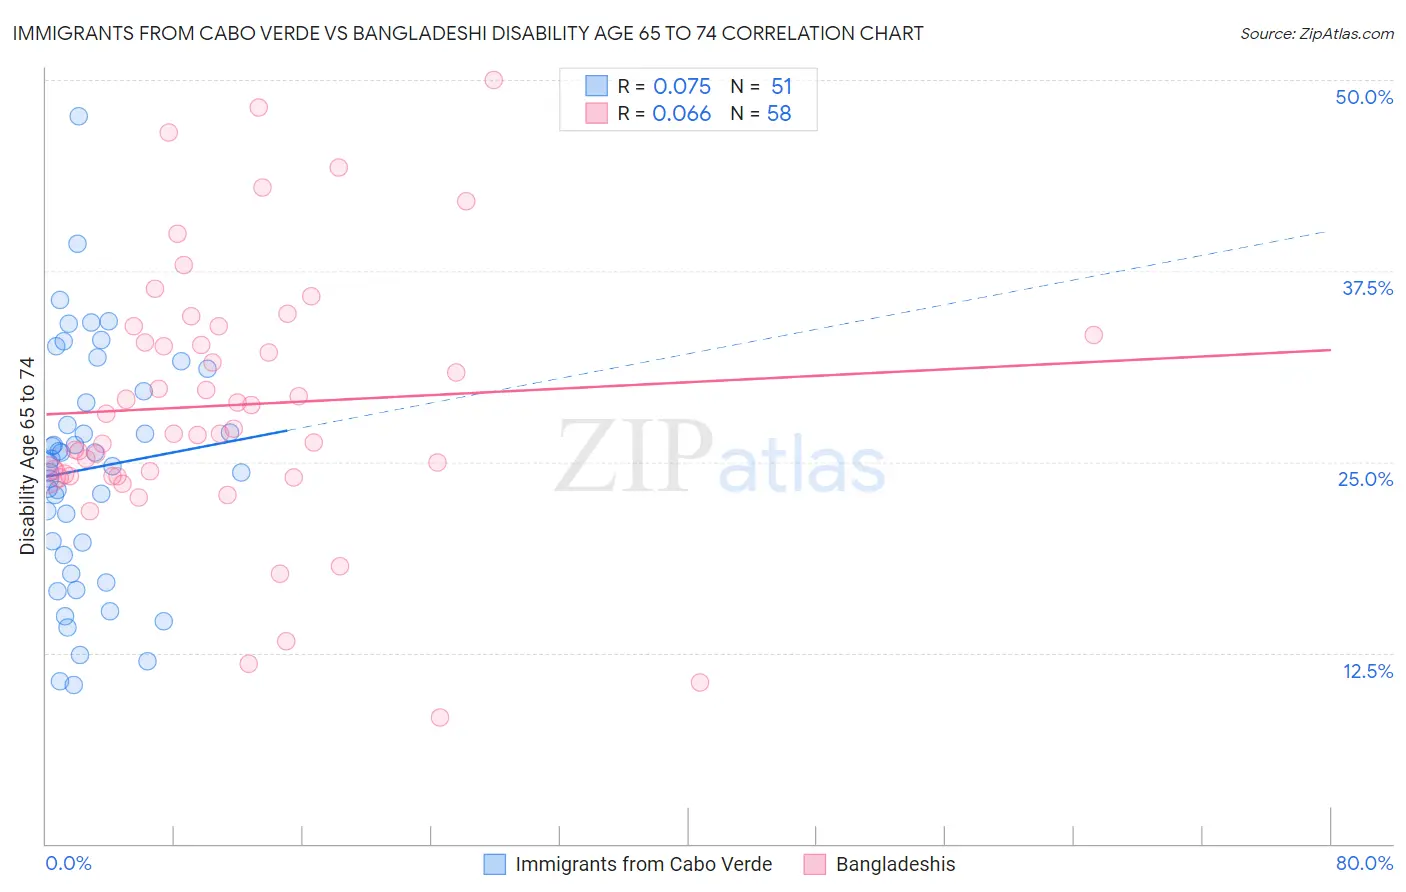
Immigrants from Cabo Verde vs Bangladeshi Disability Age 65 to 74 Correlation Chart
The statistical analysis conducted on geographies consisting of 38,130,720 people shows a slight positive correlation between the proportion of Immigrants from Cabo Verde and percentage of population with a disability between the ages 65 and 75 in the United States with a correlation coefficient (R) of 0.075 and weighted average of 26.3%. Similarly, the statistical analysis conducted on geographies consisting of 141,045,200 people shows a slight positive correlation between the proportion of Bangladeshis and percentage of population with a disability between the ages 65 and 75 in the United States with a correlation coefficient (R) of 0.066 and weighted average of 26.8%, a difference of 2.0%.
Disability Age 65 to 74 Correlation Summary
| Measurement | Immigrants from Cabo Verde | Bangladeshi |
| Minimum | 10.4% | 8.3% |
| Maximum | 47.6% | 50.0% |
| Range | 37.2% | 41.7% |
| Mean | 24.6% | 28.7% |
| Median | 24.8% | 27.0% |
| Interquartile 25% (IQ1) | 18.9% | 24.1% |
| Interquartile 75% (IQ3) | 29.6% | 33.3% |
| Interquartile Range (IQR) | 10.8% | 9.2% |
| Standard Deviation (Sample) | 7.8% | 8.6% |
| Standard Deviation (Population) | 7.7% | 8.5% |
Demographics Similar to Immigrants from Cabo Verde and Bangladeshis by Disability Age 65 to 74
In terms of disability age 65 to 74, the demographic groups most similar to Immigrants from Cabo Verde are Spanish American Indian (26.4%, a difference of 0.20%), African (26.2%, a difference of 0.31%), Mexican American Indian (26.2%, a difference of 0.62%), Immigrants from Laos (26.1%, a difference of 0.72%), and Immigrants from Micronesia (26.1%, a difference of 0.78%). Similarly, the demographic groups most similar to Bangladeshis are Fijian (27.0%, a difference of 0.59%), Hispanic or Latino (26.7%, a difference of 0.61%), Immigrants from Yemen (27.0%, a difference of 0.61%), Dominican (26.7%, a difference of 0.63%), and Potawatomi (27.0%, a difference of 0.64%).
| Demographics | Rating | Rank | Disability Age 65 to 74 |
| Spanish Americans | 0.0 /100 | #283 | Tragic 25.9% |
| Immigrants | Azores | 0.0 /100 | #284 | Tragic 26.0% |
| Immigrants | Congo | 0.0 /100 | #285 | Tragic 26.0% |
| Immigrants | Micronesia | 0.0 /100 | #286 | Tragic 26.1% |
| Immigrants | Laos | 0.0 /100 | #287 | Tragic 26.1% |
| Mexican American Indians | 0.0 /100 | #288 | Tragic 26.2% |
| Africans | 0.0 /100 | #289 | Tragic 26.2% |
| Immigrants | Cabo Verde | 0.0 /100 | #290 | Tragic 26.3% |
| Spanish American Indians | 0.0 /100 | #291 | Tragic 26.4% |
| Blackfeet | 0.0 /100 | #292 | Tragic 26.6% |
| Immigrants | Central America | 0.0 /100 | #293 | Tragic 26.6% |
| Dominicans | 0.0 /100 | #294 | Tragic 26.7% |
| Hispanics or Latinos | 0.0 /100 | #295 | Tragic 26.7% |
| Bangladeshis | 0.0 /100 | #296 | Tragic 26.8% |
| Fijians | 0.0 /100 | #297 | Tragic 27.0% |
| Immigrants | Yemen | 0.0 /100 | #298 | Tragic 27.0% |
| Potawatomi | 0.0 /100 | #299 | Tragic 27.0% |
| Immigrants | Dominican Republic | 0.0 /100 | #300 | Tragic 27.0% |
| Immigrants | Mexico | 0.0 /100 | #301 | Tragic 27.1% |
| Central American Indians | 0.0 /100 | #302 | Tragic 27.1% |
| Tlingit-Haida | 0.0 /100 | #303 | Tragic 27.1% |