Carpatho Rusyn vs Bangladeshi Disability Age 65 to 74
COMPARE
Carpatho Rusyn
Bangladeshi
Disability Age 65 to 74
Disability Age 65 to 74 Comparison
Carpatho Rusyns
Bangladeshis
21.6%
DISABILITY AGE 65 TO 74
99.5/ 100
METRIC RATING
62nd/ 347
METRIC RANK
26.8%
DISABILITY AGE 65 TO 74
0.0/ 100
METRIC RATING
296th/ 347
METRIC RANK
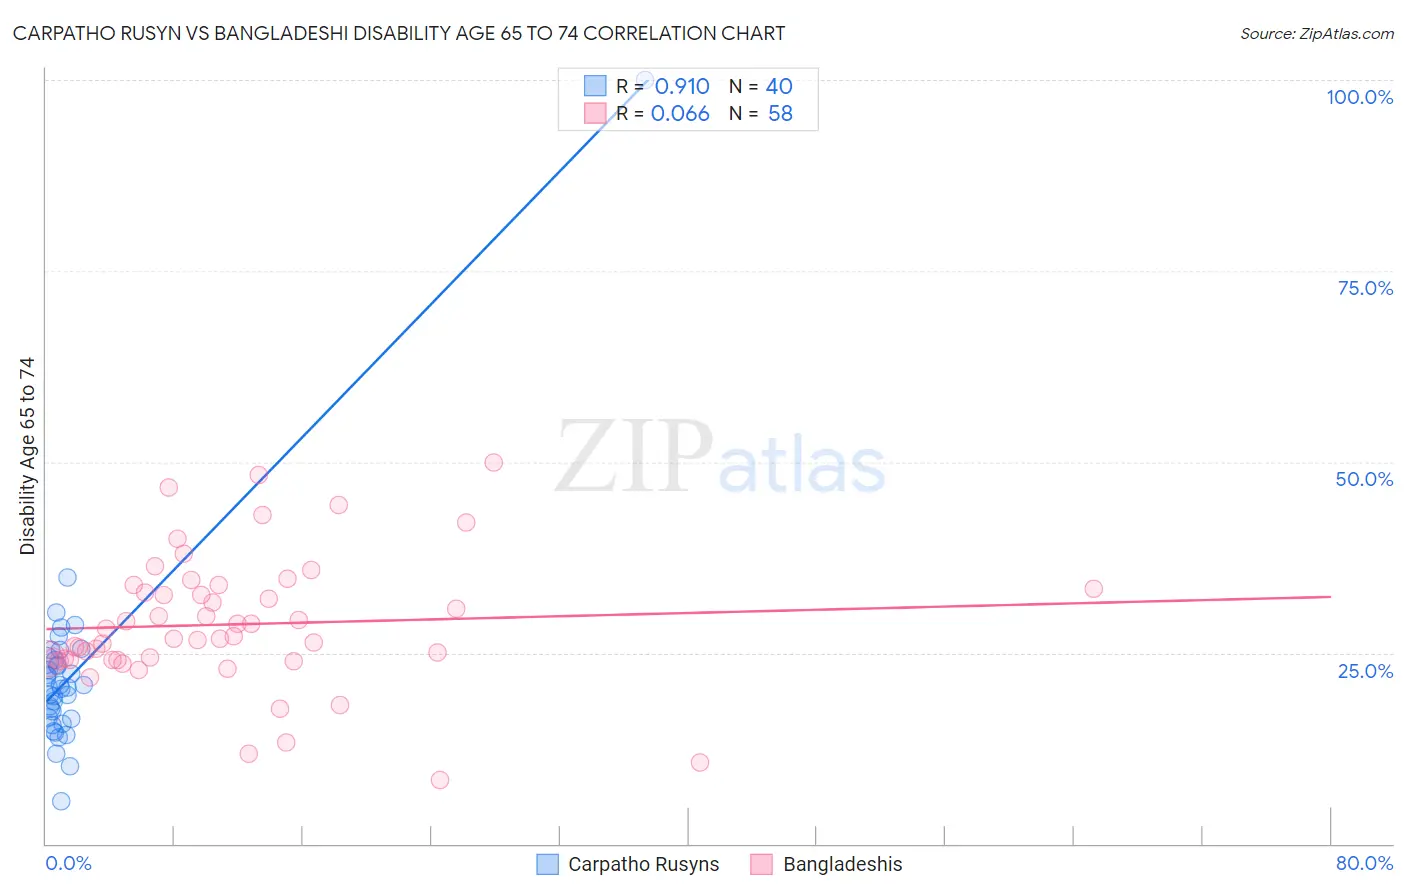
Carpatho Rusyn vs Bangladeshi Disability Age 65 to 74 Correlation Chart
The statistical analysis conducted on geographies consisting of 58,867,646 people shows a near-perfect positive correlation between the proportion of Carpatho Rusyns and percentage of population with a disability between the ages 65 and 75 in the United States with a correlation coefficient (R) of 0.910 and weighted average of 21.6%. Similarly, the statistical analysis conducted on geographies consisting of 141,045,200 people shows a slight positive correlation between the proportion of Bangladeshis and percentage of population with a disability between the ages 65 and 75 in the United States with a correlation coefficient (R) of 0.066 and weighted average of 26.8%, a difference of 24.4%.
Disability Age 65 to 74 Correlation Summary
| Measurement | Carpatho Rusyn | Bangladeshi |
| Minimum | 5.6% | 8.3% |
| Maximum | 100.0% | 50.0% |
| Range | 94.4% | 41.7% |
| Mean | 22.3% | 28.7% |
| Median | 20.5% | 27.0% |
| Interquartile 25% (IQ1) | 16.5% | 24.1% |
| Interquartile 75% (IQ3) | 24.0% | 33.3% |
| Interquartile Range (IQR) | 7.6% | 9.2% |
| Standard Deviation (Sample) | 13.8% | 8.6% |
| Standard Deviation (Population) | 13.7% | 8.5% |
Similar Demographics by Disability Age 65 to 74
Demographics Similar to Carpatho Rusyns by Disability Age 65 to 74
In terms of disability age 65 to 74, the demographic groups most similar to Carpatho Rusyns are Egyptian (21.6%, a difference of 0.030%), Immigrants from North Macedonia (21.6%, a difference of 0.050%), Zimbabwean (21.5%, a difference of 0.080%), Immigrants from Europe (21.6%, a difference of 0.10%), and Immigrants from Pakistan (21.5%, a difference of 0.11%).
| Demographics | Rating | Rank | Disability Age 65 to 74 |
| Immigrants | Romania | 99.5 /100 | #55 | Exceptional 21.5% |
| Immigrants | Denmark | 99.5 /100 | #56 | Exceptional 21.5% |
| Immigrants | Asia | 99.5 /100 | #57 | Exceptional 21.5% |
| Immigrants | Pakistan | 99.5 /100 | #58 | Exceptional 21.5% |
| Zimbabweans | 99.5 /100 | #59 | Exceptional 21.5% |
| Immigrants | North Macedonia | 99.5 /100 | #60 | Exceptional 21.6% |
| Egyptians | 99.5 /100 | #61 | Exceptional 21.6% |
| Carpatho Rusyns | 99.5 /100 | #62 | Exceptional 21.6% |
| Immigrants | Europe | 99.4 /100 | #63 | Exceptional 21.6% |
| Immigrants | Latvia | 99.4 /100 | #64 | Exceptional 21.6% |
| Immigrants | Russia | 99.4 /100 | #65 | Exceptional 21.6% |
| Maltese | 99.4 /100 | #66 | Exceptional 21.6% |
| Immigrants | South Africa | 99.3 /100 | #67 | Exceptional 21.7% |
| Immigrants | Scotland | 99.3 /100 | #68 | Exceptional 21.7% |
| Immigrants | Egypt | 99.2 /100 | #69 | Exceptional 21.7% |
Demographics Similar to Bangladeshis by Disability Age 65 to 74
In terms of disability age 65 to 74, the demographic groups most similar to Bangladeshis are Fijian (27.0%, a difference of 0.59%), Hispanic or Latino (26.7%, a difference of 0.61%), Immigrants from Yemen (27.0%, a difference of 0.61%), Dominican (26.7%, a difference of 0.63%), and Potawatomi (27.0%, a difference of 0.64%).
| Demographics | Rating | Rank | Disability Age 65 to 74 |
| Africans | 0.0 /100 | #289 | Tragic 26.2% |
| Immigrants | Cabo Verde | 0.0 /100 | #290 | Tragic 26.3% |
| Spanish American Indians | 0.0 /100 | #291 | Tragic 26.4% |
| Blackfeet | 0.0 /100 | #292 | Tragic 26.6% |
| Immigrants | Central America | 0.0 /100 | #293 | Tragic 26.6% |
| Dominicans | 0.0 /100 | #294 | Tragic 26.7% |
| Hispanics or Latinos | 0.0 /100 | #295 | Tragic 26.7% |
| Bangladeshis | 0.0 /100 | #296 | Tragic 26.8% |
| Fijians | 0.0 /100 | #297 | Tragic 27.0% |
| Immigrants | Yemen | 0.0 /100 | #298 | Tragic 27.0% |
| Potawatomi | 0.0 /100 | #299 | Tragic 27.0% |
| Immigrants | Dominican Republic | 0.0 /100 | #300 | Tragic 27.0% |
| Immigrants | Mexico | 0.0 /100 | #301 | Tragic 27.1% |
| Central American Indians | 0.0 /100 | #302 | Tragic 27.1% |
| Tlingit-Haida | 0.0 /100 | #303 | Tragic 27.1% |