West Indian vs Mongolian Family Households
COMPARE
West Indian
Mongolian
Family Households
Family Households Comparison
West Indians
Mongolians
63.1%
FAMILY HOUSEHOLDS
0.3/ 100
METRIC RATING
275th/ 347
METRIC RANK
62.8%
FAMILY HOUSEHOLDS
0.1/ 100
METRIC RATING
285th/ 347
METRIC RANK
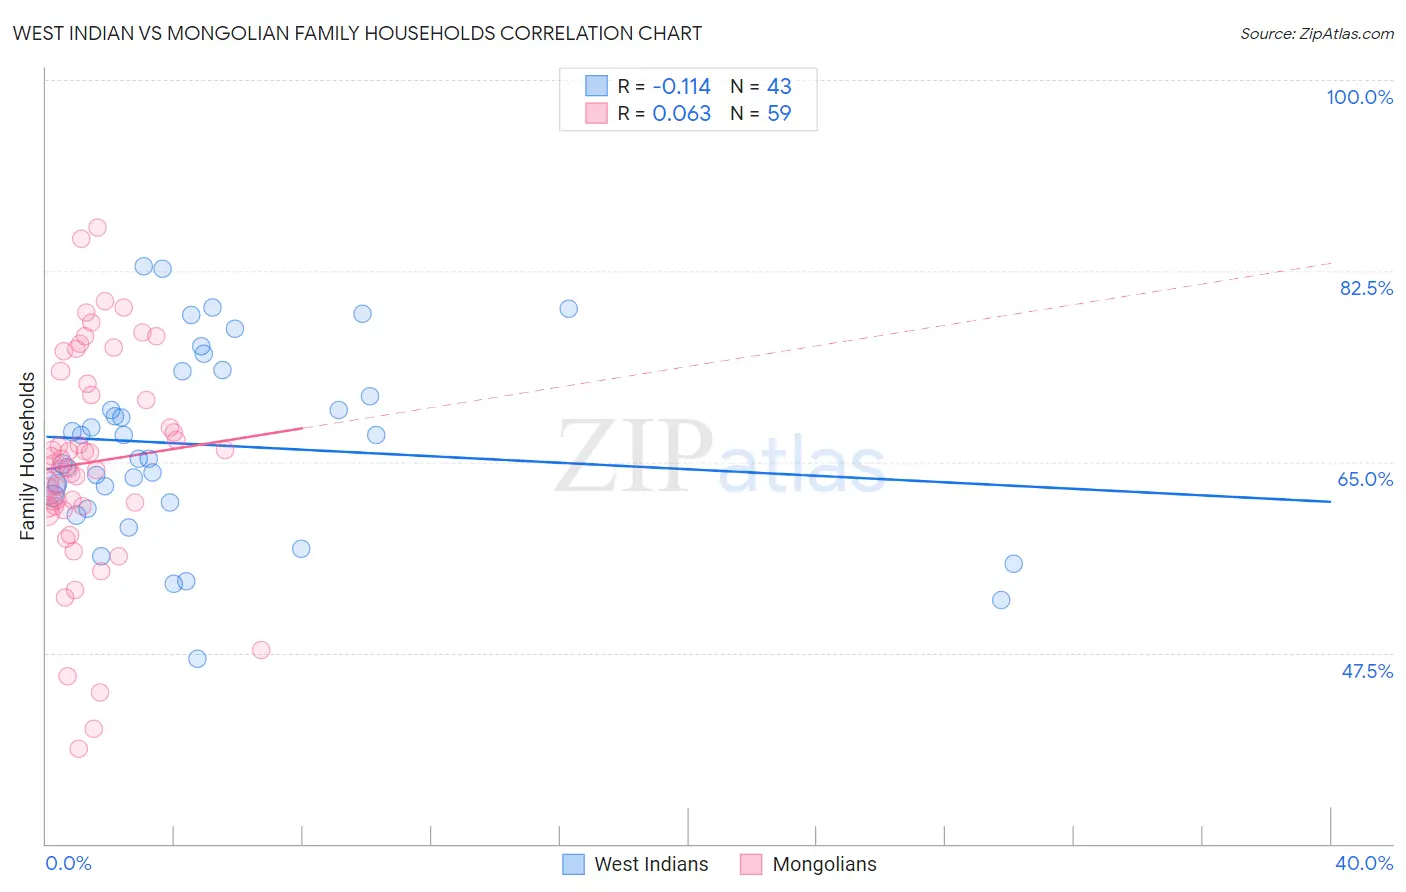
West Indian vs Mongolian Family Households Correlation Chart
The statistical analysis conducted on geographies consisting of 253,859,677 people shows a poor negative correlation between the proportion of West Indians and percentage of family households in the United States with a correlation coefficient (R) of -0.114 and weighted average of 63.1%. Similarly, the statistical analysis conducted on geographies consisting of 140,293,840 people shows a slight positive correlation between the proportion of Mongolians and percentage of family households in the United States with a correlation coefficient (R) of 0.063 and weighted average of 62.8%, a difference of 0.44%.
Family Households Correlation Summary
| Measurement | West Indian | Mongolian |
| Minimum | 47.0% | 38.8% |
| Maximum | 83.0% | 86.5% |
| Range | 36.0% | 47.8% |
| Mean | 66.5% | 65.0% |
| Median | 65.3% | 64.9% |
| Interquartile 25% (IQ1) | 61.3% | 60.9% |
| Interquartile 75% (IQ3) | 73.3% | 72.2% |
| Interquartile Range (IQR) | 12.0% | 11.3% |
| Standard Deviation (Sample) | 8.5% | 10.1% |
| Standard Deviation (Population) | 8.4% | 10.0% |
Demographics Similar to West Indians and Mongolians by Family Households
In terms of family households, the demographic groups most similar to West Indians are Lumbee (63.1%, a difference of 0.0%), Immigrants from Kazakhstan (63.1%, a difference of 0.010%), Serbian (63.0%, a difference of 0.010%), Immigrants from Croatia (63.1%, a difference of 0.020%), and Immigrants from Turkey (63.1%, a difference of 0.020%). Similarly, the demographic groups most similar to Mongolians are British West Indian (62.8%, a difference of 0.030%), Latvian (62.8%, a difference of 0.030%), Immigrants from Uganda (62.7%, a difference of 0.050%), Australian (62.8%, a difference of 0.10%), and Immigrants from Nepal (62.7%, a difference of 0.14%).
| Demographics | Rating | Rank | Family Households |
| Immigrants | Austria | 0.3 /100 | #270 | Tragic 63.1% |
| Immigrants | Croatia | 0.3 /100 | #271 | Tragic 63.1% |
| Immigrants | Turkey | 0.3 /100 | #272 | Tragic 63.1% |
| Immigrants | Kazakhstan | 0.3 /100 | #273 | Tragic 63.1% |
| Lumbee | 0.3 /100 | #274 | Tragic 63.1% |
| West Indians | 0.3 /100 | #275 | Tragic 63.1% |
| Serbians | 0.3 /100 | #276 | Tragic 63.0% |
| Ottawa | 0.3 /100 | #277 | Tragic 63.0% |
| Immigrants | Belgium | 0.2 /100 | #278 | Tragic 63.0% |
| Immigrants | Yemen | 0.2 /100 | #279 | Tragic 63.0% |
| Immigrants | Bulgaria | 0.2 /100 | #280 | Tragic 63.0% |
| Estonians | 0.2 /100 | #281 | Tragic 62.9% |
| New Zealanders | 0.1 /100 | #282 | Tragic 62.9% |
| Immigrants | Denmark | 0.1 /100 | #283 | Tragic 62.9% |
| Australians | 0.1 /100 | #284 | Tragic 62.8% |
| Mongolians | 0.1 /100 | #285 | Tragic 62.8% |
| British West Indians | 0.1 /100 | #286 | Tragic 62.8% |
| Latvians | 0.1 /100 | #287 | Tragic 62.8% |
| Immigrants | Uganda | 0.1 /100 | #288 | Tragic 62.7% |
| Immigrants | Nepal | 0.1 /100 | #289 | Tragic 62.7% |
| Immigrants | Grenada | 0.0 /100 | #290 | Tragic 62.6% |