West Indian vs Immigrants from Zaire Female Disability
COMPARE
West Indian
Immigrants from Zaire
Female Disability
Female Disability Comparison
West Indians
Immigrants from Zaire
12.8%
FEMALE DISABILITY
0.5/ 100
METRIC RATING
265th/ 347
METRIC RANK
12.3%
FEMALE DISABILITY
20.9/ 100
METRIC RATING
204th/ 347
METRIC RANK
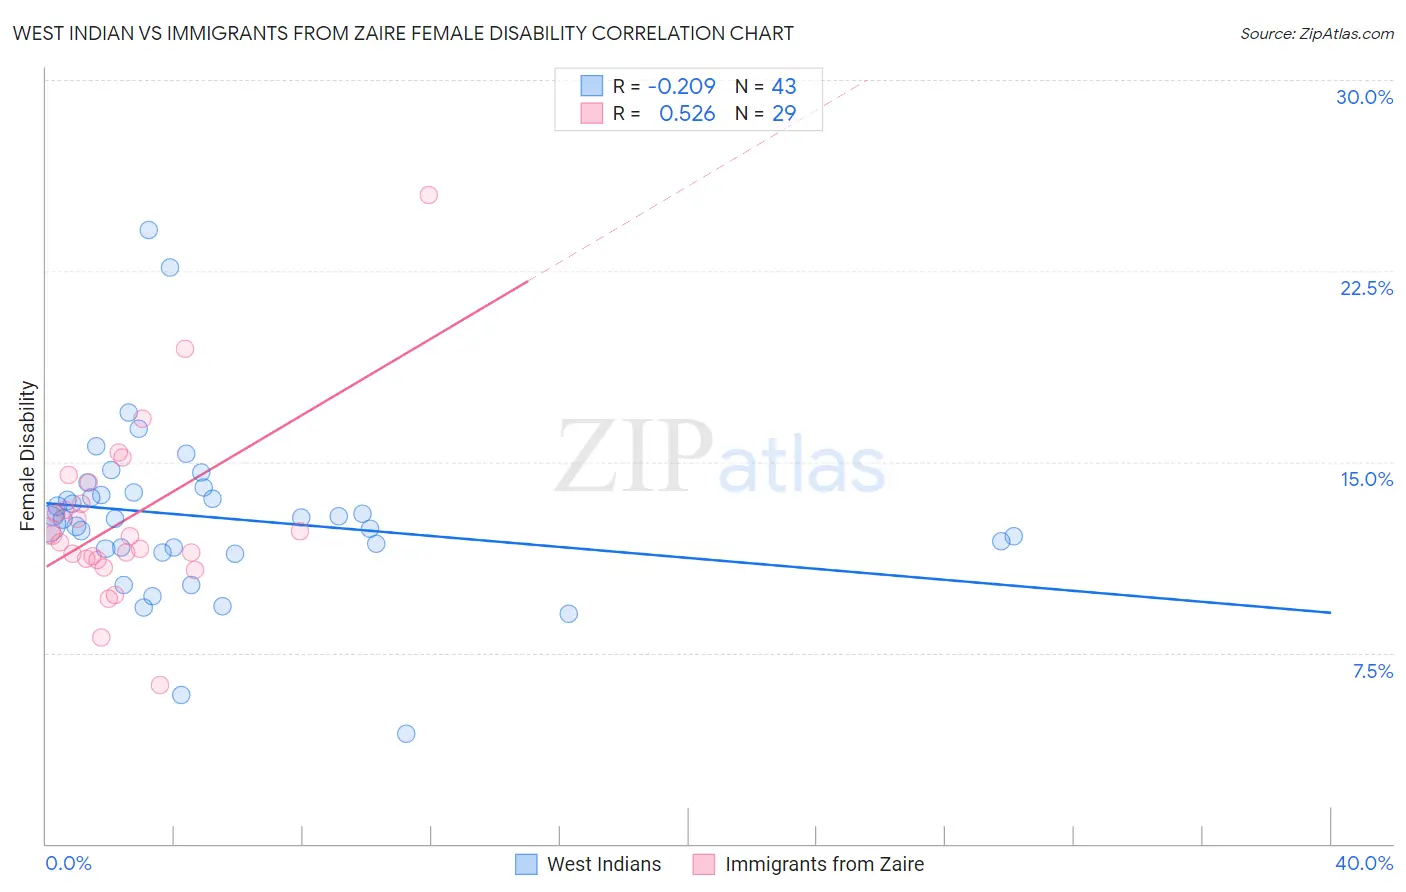
West Indian vs Immigrants from Zaire Female Disability Correlation Chart
The statistical analysis conducted on geographies consisting of 254,014,904 people shows a weak negative correlation between the proportion of West Indians and percentage of females with a disability in the United States with a correlation coefficient (R) of -0.209 and weighted average of 12.8%. Similarly, the statistical analysis conducted on geographies consisting of 107,254,316 people shows a substantial positive correlation between the proportion of Immigrants from Zaire and percentage of females with a disability in the United States with a correlation coefficient (R) of 0.526 and weighted average of 12.3%, a difference of 3.7%.
Female Disability Correlation Summary
| Measurement | West Indian | Immigrants from Zaire |
| Minimum | 4.3% | 6.2% |
| Maximum | 24.1% | 25.5% |
| Range | 19.8% | 19.3% |
| Mean | 12.8% | 12.7% |
| Median | 12.8% | 12.1% |
| Interquartile 25% (IQ1) | 11.6% | 11.2% |
| Interquartile 75% (IQ3) | 13.8% | 13.8% |
| Interquartile Range (IQR) | 2.2% | 2.6% |
| Standard Deviation (Sample) | 3.4% | 3.5% |
| Standard Deviation (Population) | 3.3% | 3.5% |
Similar Demographics by Female Disability
Demographics Similar to West Indians by Female Disability
In terms of female disability, the demographic groups most similar to West Indians are Finnish (12.8%, a difference of 0.12%), Senegalese (12.8%, a difference of 0.13%), Immigrants from Laos (12.8%, a difference of 0.16%), Alaska Native (12.8%, a difference of 0.19%), and Indonesian (12.8%, a difference of 0.22%).
| Demographics | Rating | Rank | Female Disability |
| Aleuts | 1.1 /100 | #258 | Tragic 12.7% |
| Immigrants | Armenia | 1.0 /100 | #259 | Tragic 12.7% |
| Sub-Saharan Africans | 1.0 /100 | #260 | Tragic 12.7% |
| Bermudans | 1.0 /100 | #261 | Tragic 12.7% |
| Czechoslovakians | 0.9 /100 | #262 | Tragic 12.7% |
| Spaniards | 0.7 /100 | #263 | Tragic 12.8% |
| Alaska Natives | 0.6 /100 | #264 | Tragic 12.8% |
| West Indians | 0.5 /100 | #265 | Tragic 12.8% |
| Finns | 0.4 /100 | #266 | Tragic 12.8% |
| Senegalese | 0.4 /100 | #267 | Tragic 12.8% |
| Immigrants | Laos | 0.4 /100 | #268 | Tragic 12.8% |
| Indonesians | 0.4 /100 | #269 | Tragic 12.8% |
| Immigrants | Liberia | 0.3 /100 | #270 | Tragic 12.9% |
| Dutch | 0.2 /100 | #271 | Tragic 12.9% |
| Germans | 0.1 /100 | #272 | Tragic 12.9% |
Demographics Similar to Immigrants from Zaire by Female Disability
In terms of female disability, the demographic groups most similar to Immigrants from Zaire are Immigrants from Barbados (12.3%, a difference of 0.020%), Immigrants from Grenada (12.4%, a difference of 0.020%), Somali (12.3%, a difference of 0.040%), Immigrants from Cuba (12.4%, a difference of 0.040%), and Croatian (12.4%, a difference of 0.040%).
| Demographics | Rating | Rank | Female Disability |
| Hondurans | 25.4 /100 | #197 | Fair 12.3% |
| Mexican American Indians | 24.9 /100 | #198 | Fair 12.3% |
| Immigrants | Trinidad and Tobago | 24.7 /100 | #199 | Fair 12.3% |
| Trinidadians and Tobagonians | 22.4 /100 | #200 | Fair 12.3% |
| Chinese | 22.1 /100 | #201 | Fair 12.3% |
| Somalis | 21.5 /100 | #202 | Fair 12.3% |
| Immigrants | Barbados | 21.1 /100 | #203 | Fair 12.3% |
| Immigrants | Zaire | 20.9 /100 | #204 | Fair 12.3% |
| Immigrants | Grenada | 20.5 /100 | #205 | Fair 12.4% |
| Immigrants | Cuba | 20.2 /100 | #206 | Fair 12.4% |
| Croatians | 20.2 /100 | #207 | Fair 12.4% |
| Basques | 17.5 /100 | #208 | Poor 12.4% |
| Mexicans | 15.7 /100 | #209 | Poor 12.4% |
| Swiss | 14.9 /100 | #210 | Poor 12.4% |
| Immigrants | Bosnia and Herzegovina | 14.8 /100 | #211 | Poor 12.4% |