West Indian vs Immigrants from Scotland Female Disability

COMPARE

West Indian
Race
Ancestry
AfghanAfricanAlaska NativeAlaskan AthabascanAlbanianAleutAlsatianAmericanApacheArabArapahoArgentineanArmenianAssyrian/Chaldean/SyriacAustralianAustrianBahamianBangladeshiBarbadianBasqueBelgianBelizeanBermudanBhutaneseBlackfeetBolivianBrazilianBritishBritish West IndianBulgarianBurmeseCajunCambodianCanadianCape VerdeanCarpatho RusynCelticCentral AmericanCentral American IndianCherokeeCheyenneChickasawChileanChineseChippewaChoctawColombianColvilleComancheCosta RicanCreeCreekCroatianCrowCubanCypriotCzechCzechoslovakianDanishDelawareDominicanDutchDutch West IndianEastern EuropeanEcuadorianEgyptianEnglishEstonianEthiopianEuropeanFijianFilipinoFinnishFrenchFrench American IndianFrench CanadianGermanGerman RussianGhanaianGreekGuamanian/ChamorroGuatemalanGuyaneseHaitianHmongHonduranHopiHoumaHungarianIcelanderIndian (Asian)IndonesianInupiatIranianIraqiIrishIroquoisIsraeliItalianJamaicanJapaneseJordanianKenyanKiowaKoreanLaotianLatvianLebaneseLiberianLithuanianLumbeeLuxembourgerMacedonianMalaysianMalteseMarshalleseMenomineeMexicanMexican American IndianMongolianMoroccanNative HawaiianNavajoNepaleseNew ZealanderNicaraguanNigerianNorthern EuropeanNorwegianOkinawanOsageOttawaPaiutePakistaniPalestinianPanamanianParaguayanPennsylvania GermanPeruvianPimaPolishPortuguesePotawatomiPuebloPuerto RicanPuget Sound SalishRomanianRussianSalvadoranSamoanScandinavianScotch-IrishScottishSeminoleSenegaleseSerbianShoshoneSierra LeoneanSiouxSlavicSlovakSloveneSomaliSouth AfricanSouth AmericanSouth American IndianSoviet UnionSpaniardSpanishSpanish AmericanSpanish American IndianSri LankanSubsaharan AfricanSudaneseSwedishSwissSyrianTaiwaneseThaiTlingit-HaidaTohono O'OdhamTonganTrinidadian and TobagonianTsimshianTurkishU.S. Virgin IslanderUgandanUkrainianUruguayanUteVenezuelanVietnameseWelshWest IndianYakamaYaquiYugoslavianYumanYup'ikZimbabwean
Immigration
NonimmigrantsImmigrantsAfghanistanAfricaAlbaniaArgentinaArmeniaAsiaAustraliaAustriaBahamasBangladeshBarbadosBelarusBelgiumBelizeBoliviaBosnia and HerzegovinaBrazilBulgariaBurma/MyanmarCabo VerdeCambodiaCameroonCanadaCaribbeanCentral AmericaChileChinaColombiaCongoCosta RicaCroatiaCubaCzechoslovakiaDenmarkDominicaDominican RepublicEastern AfricaEastern AsiaEastern EuropeEcuadorEgyptEl SalvadorEnglandEritreaEthiopiaEuropeFijiFranceGermanyGhanaGreeceGrenadaGuatemalaGuyanaHaitiHondurasHong KongHungaryIndiaIndonesiaIranIraqIrelandIsraelItalyJamaicaJapanJordanKazakhstanKenyaKoreaKuwaitLaosLatin AmericaLatviaLebanonLiberiaLithuaniaMalaysiaMexicoMicronesiaMiddle AfricaMoldovaMoroccoNepalNetherlandsNicaraguaNigeriaNorth AmericaNorth MacedoniaNorthern AfricaNorthern EuropeNorwayOceaniaPakistanPanamaPeruPhilippinesPolandPortugalRomaniaRussiaSaudi ArabiaSenegalSerbiaSierra LeoneSingaporeSomaliaSouth AfricaSouth AmericaSouth Central AsiaSouth Eastern AsiaSouthern EuropeSpainSri LankaSt. Vincent and the GrenadinesSudanSwedenSwitzerlandSyriaTaiwanThailandTrinidad and TobagoTurkeyUgandaUkraineUruguayUzbekistanVenezuelaVietnamWest IndiesWestern AfricaWestern AsiaWestern EuropeYemenZaireZimbabweAzores
Immigrants from Scotland
Race
Ancestry
AfghanAfricanAlaska NativeAlaskan AthabascanAlbanianAleutAlsatianAmericanApacheArabArapahoArgentineanArmenianAssyrian/Chaldean/SyriacAustralianAustrianBahamianBangladeshiBarbadianBasqueBelgianBelizeanBermudanBhutaneseBlackfeetBolivianBrazilianBritishBritish West IndianBulgarianBurmeseCajunCambodianCanadianCape VerdeanCarpatho RusynCelticCentral AmericanCentral American IndianCherokeeCheyenneChickasawChileanChineseChippewaChoctawColombianColvilleComancheCosta RicanCreeCreekCroatianCrowCubanCypriotCzechCzechoslovakianDanishDelawareDominicanDutchDutch West IndianEastern EuropeanEcuadorianEgyptianEnglishEstonianEthiopianEuropeanFijianFilipinoFinnishFrenchFrench American IndianFrench CanadianGermanGerman RussianGhanaianGreekGuamanian/ChamorroGuatemalanGuyaneseHaitianHmongHonduranHopiHoumaHungarianIcelanderIndian (Asian)IndonesianInupiatIranianIraqiIrishIroquoisIsraeliItalianJamaicanJapaneseJordanianKenyanKiowaKoreanLaotianLatvianLebaneseLiberianLithuanianLumbeeLuxembourgerMacedonianMalaysianMalteseMarshalleseMenomineeMexicanMexican American IndianMongolianMoroccanNative HawaiianNavajoNepaleseNew ZealanderNicaraguanNigerianNorthern EuropeanNorwegianOkinawanOsageOttawaPaiutePakistaniPalestinianPanamanianParaguayanPennsylvania GermanPeruvianPimaPolishPortuguesePotawatomiPuebloPuerto RicanPuget Sound SalishRomanianRussianSalvadoranSamoanScandinavianScotch-IrishScottishSeminoleSenegaleseSerbianShoshoneSierra LeoneanSiouxSlavicSlovakSloveneSomaliSouth AfricanSouth AmericanSouth American IndianSoviet UnionSpaniardSpanishSpanish AmericanSpanish American IndianSri LankanSubsaharan AfricanSudaneseSwedishSwissSyrianTaiwaneseThaiTlingit-HaidaTohono O'OdhamTonganTrinidadian and TobagonianTsimshianTurkishU.S. Virgin IslanderUgandanUkrainianUruguayanUteVenezuelanVietnameseWelshYakamaYaquiYugoslavianYumanYup'ikZimbabwean
Immigration
NonimmigrantsImmigrantsAfghanistanAfricaAlbaniaArgentinaArmeniaAsiaAustraliaAustriaBahamasBangladeshBarbadosBelarusBelgiumBelizeBoliviaBosnia and HerzegovinaBrazilBulgariaBurma/MyanmarCabo VerdeCambodiaCameroonCanadaCaribbeanCentral AmericaChileChinaColombiaCongoCosta RicaCroatiaCubaCzechoslovakiaDenmarkDominicaDominican RepublicEastern AfricaEastern AsiaEastern EuropeEcuadorEgyptEl SalvadorEnglandEritreaEthiopiaEuropeFijiFranceGermanyGhanaGreeceGrenadaGuatemalaGuyanaHaitiHondurasHong KongHungaryIndiaIndonesiaIranIraqIrelandIsraelItalyJamaicaJapanJordanKazakhstanKenyaKoreaKuwaitLaosLatin AmericaLatviaLebanonLiberiaLithuaniaMalaysiaMexicoMicronesiaMiddle AfricaMoldovaMoroccoNepalNetherlandsNicaraguaNigeriaNorth AmericaNorth MacedoniaNorthern AfricaNorthern EuropeNorwayOceaniaPakistanPanamaPeruPhilippinesPolandPortugalRomaniaRussiaSaudi ArabiaScotlandSenegalSerbiaSierra LeoneSingaporeSomaliaSouth AfricaSouth AmericaSouth Central AsiaSouth Eastern AsiaSouthern EuropeSpainSri LankaSt. Vincent and the GrenadinesSudanSwedenSwitzerlandSyriaTaiwanThailandTrinidad and TobagoTurkeyUgandaUkraineUruguayUzbekistanVenezuelaVietnamWest IndiesWestern AfricaWestern AsiaWestern EuropeYemenZaireZimbabweAzores
Female Disability
Income
Poverty
Unemployment
Labor Participation
Family Structure
Vehicle Availability
Education Level
Disability

Female Disability Comparison

West Indians

Immigrants from Scotland

Tragic
Good
12.8%
FEMALE DISABILITY
0.5/ 100
METRIC RATING
265th/ 347
METRIC RANK
12.0%
FEMALE DISABILITY
79.3/ 100
METRIC RATING
152nd/ 347
METRIC RANK

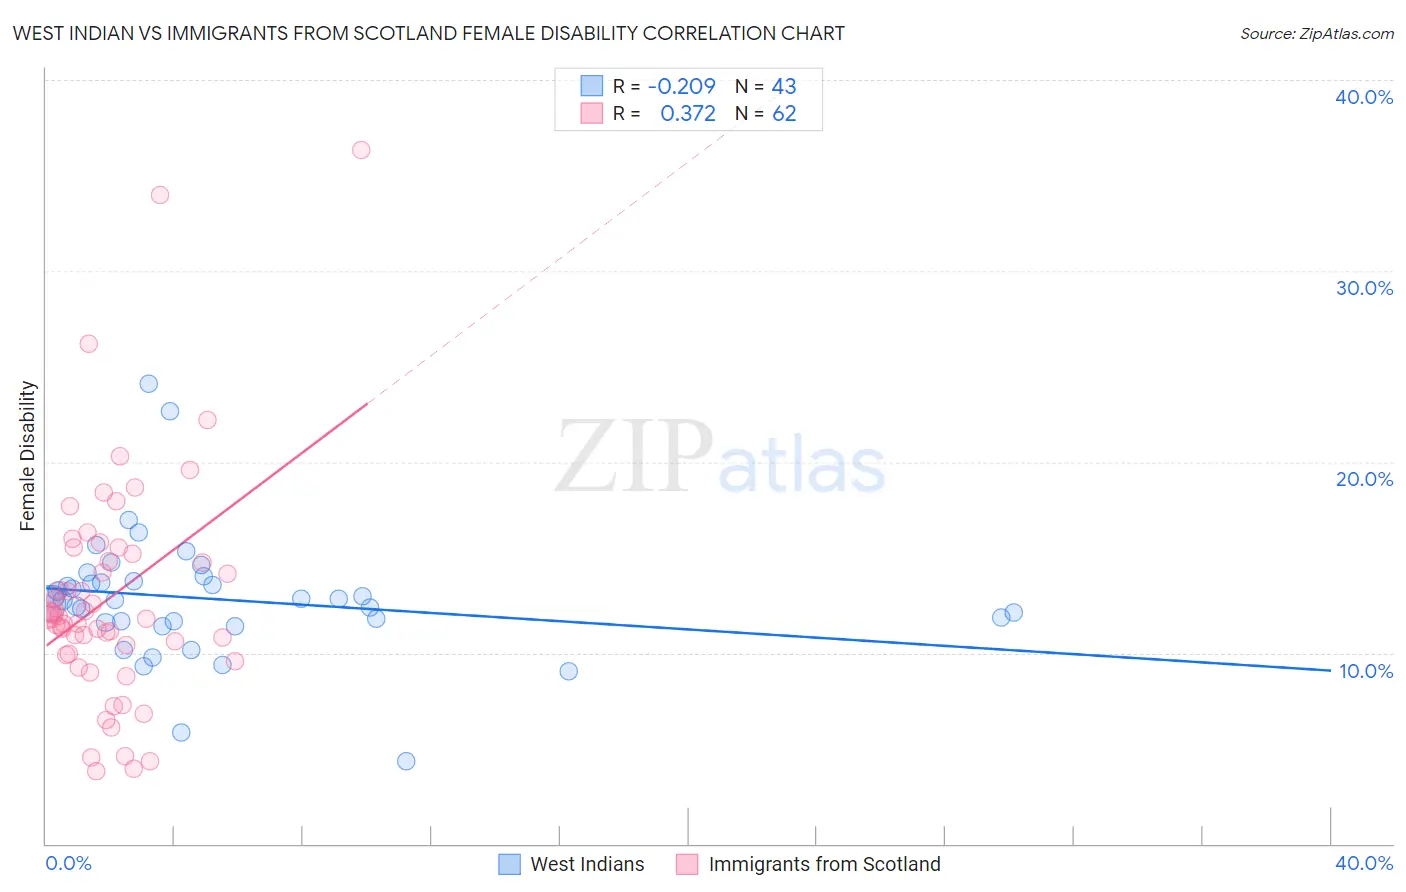
West Indian vs Immigrants from Scotland Female Disability Correlation Chart

The statistical analysis conducted on geographies consisting of 254,014,904 people shows a weak negative correlation between the proportion of West Indians and percentage of females with a disability in the United States with a correlation coefficient (R) of -0.209 and weighted average of 12.8%. Similarly, the statistical analysis conducted on geographies consisting of 196,394,283 people shows a mild positive correlation between the proportion of Immigrants from Scotland and percentage of females with a disability in the United States with a correlation coefficient (R) of 0.372 and weighted average of 12.0%, a difference of 6.3%.
West Indian vs Immigrants from Scotland Female Disability

Female Disability Correlation Summary

MeasurementWest IndianImmigrants from Scotland
Minimum4.3%3.8%
Maximum24.1%36.4%
Range19.8%32.6%
Mean12.8%12.9%
Median12.8%11.9%
Interquartile 25% (IQ1)11.6%9.9%
Interquartile 75% (IQ3)13.8%15.2%
Interquartile Range (IQR)2.2%5.3%
Standard Deviation (Sample)3.4%6.0%
Standard Deviation (Population)3.3%6.0%

Similar Demographics by Female Disability

Demographics Similar to West Indians by Female Disability

In terms of female disability, the demographic groups most similar to West Indians are Finnish (12.8%, a difference of 0.12%), Senegalese (12.8%, a difference of 0.13%), Immigrants from Laos (12.8%, a difference of 0.16%), Alaska Native (12.8%, a difference of 0.19%), and Indonesian (12.8%, a difference of 0.22%).
DemographicsRating | RankFemale Disability
Aleuts
1.1
/100
|
#258
Tragic
12.7%
Immigrants | Armenia
1.0
/100
|
#259
Tragic
12.7%
Sub-Saharan Africans
1.0
/100
|
#260
Tragic
12.7%
Bermudans
1.0
/100
|
#261
Tragic
12.7%
Czechoslovakians
0.9
/100
|
#262
Tragic
12.7%
Spaniards
0.7
/100
|
#263
Tragic
12.8%
Alaska Natives
0.6
/100
|
#264
Tragic
12.8%
West Indians
0.5
/100
|
#265
Tragic
12.8%
Finns
0.4
/100
|
#266
Tragic
12.8%
Senegalese
0.4
/100
|
#267
Tragic
12.8%
Immigrants | Laos
0.4
/100
|
#268
Tragic
12.8%
Indonesians
0.4
/100
|
#269
Tragic
12.8%
Immigrants | Liberia
0.3
/100
|
#270
Tragic
12.9%
Dutch
0.2
/100
|
#271
Tragic
12.9%
Germans
0.1
/100
|
#272
Tragic
12.9%

Demographics Similar to Immigrants from Scotland by Female Disability

In terms of female disability, the demographic groups most similar to Immigrants from Scotland are Sudanese (12.0%, a difference of 0.010%), Icelander (12.0%, a difference of 0.090%), Immigrants from Moldova (12.0%, a difference of 0.13%), Syrian (12.1%, a difference of 0.13%), and Ghanaian (12.1%, a difference of 0.15%).
DemographicsRating | RankFemale Disability
Estonians
87.8
/100
|
#145
Excellent
12.0%
Pakistanis
84.6
/100
|
#146
Excellent
12.0%
Nigerians
84.0
/100
|
#147
Excellent
12.0%
Immigrants | Kenya
83.1
/100
|
#148
Excellent
12.0%
Greeks
82.0
/100
|
#149
Excellent
12.0%
Immigrants | Moldova
81.4
/100
|
#150
Excellent
12.0%
Icelanders
80.7
/100
|
#151
Excellent
12.0%
Immigrants | Scotland
79.3
/100
|
#152
Good
12.0%
Sudanese
79.1
/100
|
#153
Good
12.0%
Syrians
76.9
/100
|
#154
Good
12.1%
Ghanaians
76.6
/100
|
#155
Good
12.1%
Moroccans
72.9
/100
|
#156
Good
12.1%
Danes
72.5
/100
|
#157
Good
12.1%
Immigrants | Middle Africa
72.4
/100
|
#158
Good
12.1%
Immigrants | Central America
67.7
/100
|
#159
Good
12.1%