Immigrants from Taiwan vs Ute Disability
COMPARE
Immigrants from Taiwan
Ute
Disability
Disability Comparison
Immigrants from Taiwan
Ute
9.6%
DISABILITY
100.0/ 100
METRIC RATING
3rd/ 347
METRIC RANK
11.9%
DISABILITY
19.5/ 100
METRIC RATING
191st/ 347
METRIC RANK
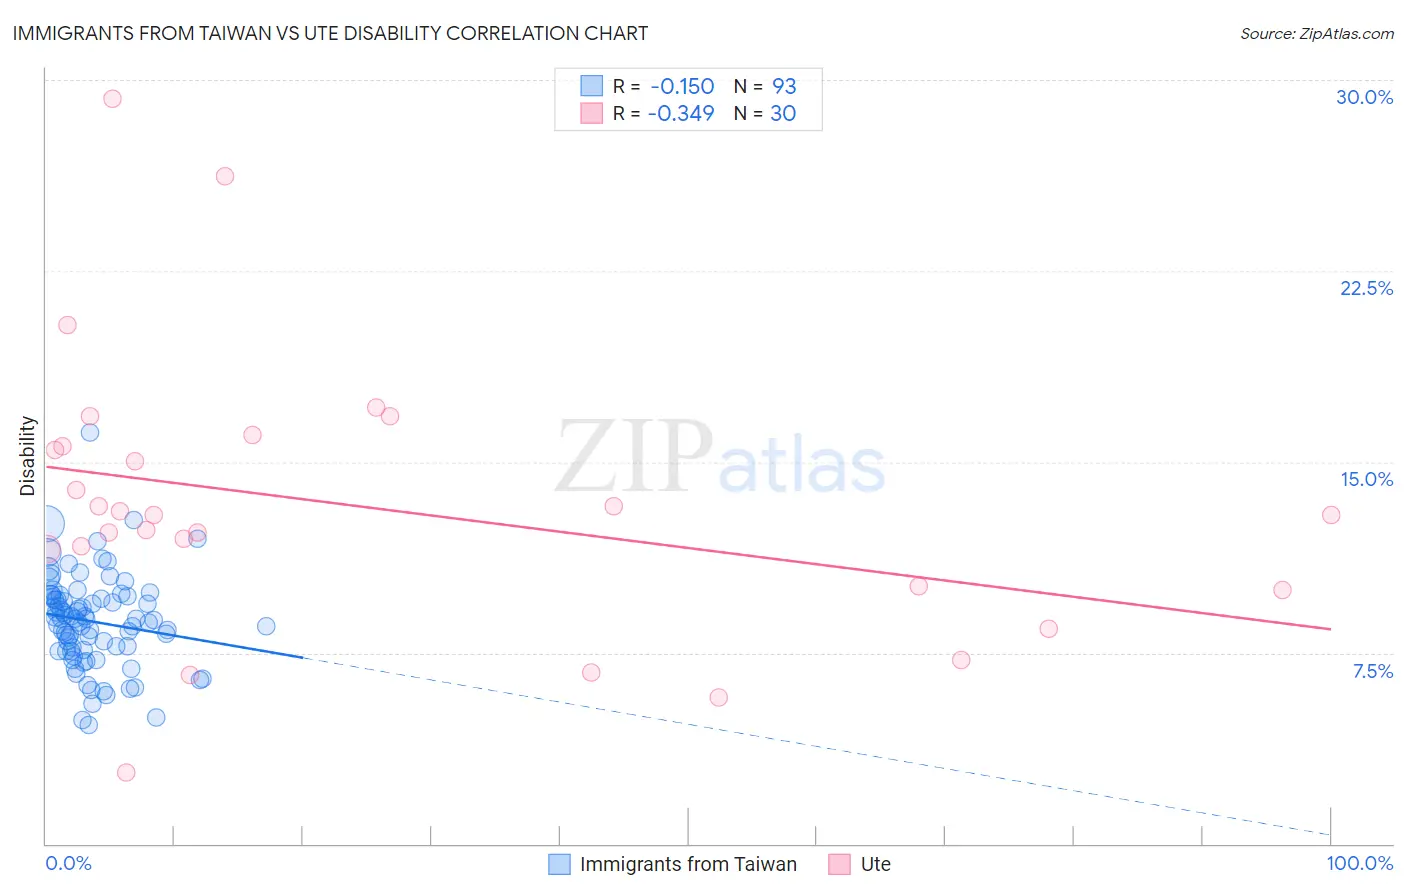
Immigrants from Taiwan vs Ute Disability Correlation Chart
The statistical analysis conducted on geographies consisting of 298,248,980 people shows a poor negative correlation between the proportion of Immigrants from Taiwan and percentage of population with a disability in the United States with a correlation coefficient (R) of -0.150 and weighted average of 9.6%. Similarly, the statistical analysis conducted on geographies consisting of 55,668,381 people shows a mild negative correlation between the proportion of Ute and percentage of population with a disability in the United States with a correlation coefficient (R) of -0.349 and weighted average of 11.9%, a difference of 23.7%.
Disability Correlation Summary
| Measurement | Immigrants from Taiwan | Ute |
| Minimum | 4.6% | 2.8% |
| Maximum | 16.2% | 29.3% |
| Range | 11.5% | 26.5% |
| Mean | 8.7% | 13.3% |
| Median | 8.8% | 12.9% |
| Interquartile 25% (IQ1) | 7.6% | 10.1% |
| Interquartile 75% (IQ3) | 9.7% | 15.6% |
| Interquartile Range (IQR) | 2.1% | 5.5% |
| Standard Deviation (Sample) | 1.8% | 5.5% |
| Standard Deviation (Population) | 1.8% | 5.4% |
Similar Demographics by Disability
Demographics Similar to Immigrants from Taiwan by Disability
In terms of disability, the demographic groups most similar to Immigrants from Taiwan are Filipino (9.6%, a difference of 0.080%), Immigrants from India (9.5%, a difference of 1.1%), Thai (9.7%, a difference of 1.1%), Immigrants from Bolivia (9.9%, a difference of 2.7%), and Immigrants from South Central Asia (9.9%, a difference of 3.6%).
| Demographics | Rating | Rank | Disability |
| Immigrants | India | 100.0 /100 | #1 | Exceptional 9.5% |
| Filipinos | 100.0 /100 | #2 | Exceptional 9.6% |
| Immigrants | Taiwan | 100.0 /100 | #3 | Exceptional 9.6% |
| Thais | 100.0 /100 | #4 | Exceptional 9.7% |
| Immigrants | Bolivia | 100.0 /100 | #5 | Exceptional 9.9% |
| Immigrants | South Central Asia | 100.0 /100 | #6 | Exceptional 9.9% |
| Immigrants | Singapore | 100.0 /100 | #7 | Exceptional 10.0% |
| Bolivians | 100.0 /100 | #8 | Exceptional 10.0% |
| Immigrants | Hong Kong | 100.0 /100 | #9 | Exceptional 10.0% |
| Immigrants | China | 100.0 /100 | #10 | Exceptional 10.1% |
| Iranians | 100.0 /100 | #11 | Exceptional 10.1% |
| Immigrants | Israel | 100.0 /100 | #12 | Exceptional 10.1% |
| Immigrants | Eastern Asia | 100.0 /100 | #13 | Exceptional 10.2% |
| Immigrants | Korea | 100.0 /100 | #14 | Exceptional 10.2% |
| Okinawans | 100.0 /100 | #15 | Exceptional 10.3% |
Demographics Similar to Ute by Disability
In terms of disability, the demographic groups most similar to Ute are Lithuanian (11.9%, a difference of 0.050%), Immigrants from Bosnia and Herzegovina (11.9%, a difference of 0.10%), Immigrants from West Indies (11.9%, a difference of 0.11%), Immigrants from Zaire (11.9%, a difference of 0.16%), and Somali (11.9%, a difference of 0.16%).
| Demographics | Rating | Rank | Disability |
| Iraqis | 30.0 /100 | #184 | Fair 11.8% |
| Immigrants | Burma/Myanmar | 28.5 /100 | #185 | Fair 11.8% |
| Immigrants | Scotland | 28.2 /100 | #186 | Fair 11.8% |
| Lebanese | 27.9 /100 | #187 | Fair 11.8% |
| Immigrants | Mexico | 23.8 /100 | #188 | Fair 11.9% |
| Immigrants | Zaire | 21.8 /100 | #189 | Fair 11.9% |
| Immigrants | West Indies | 21.1 /100 | #190 | Fair 11.9% |
| Ute | 19.5 /100 | #191 | Poor 11.9% |
| Lithuanians | 18.8 /100 | #192 | Poor 11.9% |
| Immigrants | Bosnia and Herzegovina | 18.0 /100 | #193 | Poor 11.9% |
| Somalis | 17.3 /100 | #194 | Poor 11.9% |
| Barbadians | 15.8 /100 | #195 | Poor 11.9% |
| Serbians | 15.4 /100 | #196 | Poor 11.9% |
| Immigrants | Belize | 15.2 /100 | #197 | Poor 11.9% |
| Ukrainians | 14.7 /100 | #198 | Poor 11.9% |