Mongolian vs Ottawa Male Disability
COMPARE
Mongolian
Ottawa
Male Disability
Male Disability Comparison
Mongolians
Ottawa
10.3%
MALE DISABILITY
99.7/ 100
METRIC RATING
42nd/ 347
METRIC RANK
14.1%
MALE DISABILITY
0.0/ 100
METRIC RATING
325th/ 347
METRIC RANK
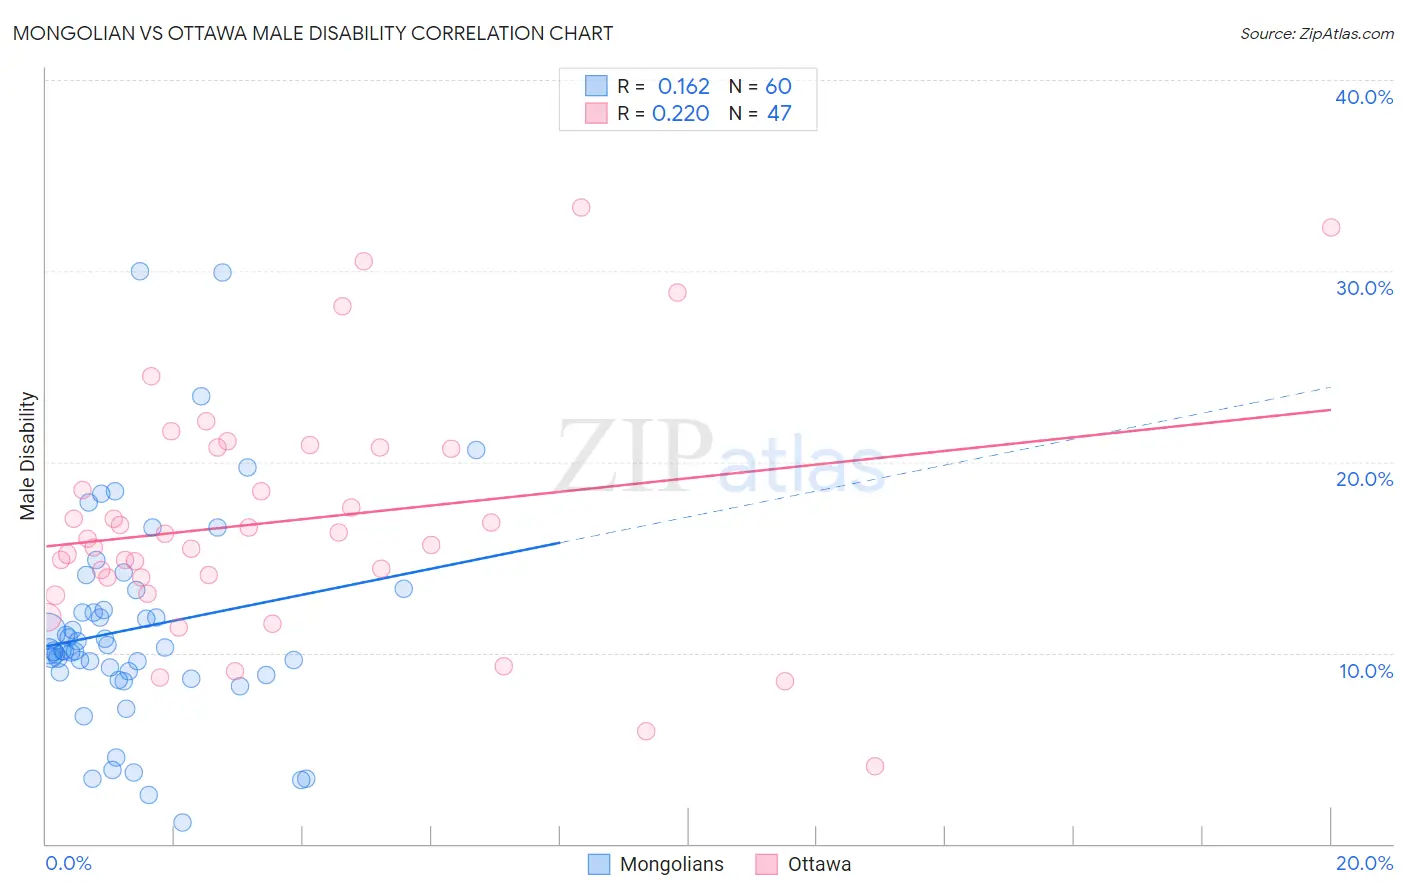
Mongolian vs Ottawa Male Disability Correlation Chart
The statistical analysis conducted on geographies consisting of 140,361,312 people shows a poor positive correlation between the proportion of Mongolians and percentage of males with a disability in the United States with a correlation coefficient (R) of 0.162 and weighted average of 10.3%. Similarly, the statistical analysis conducted on geographies consisting of 49,955,365 people shows a weak positive correlation between the proportion of Ottawa and percentage of males with a disability in the United States with a correlation coefficient (R) of 0.220 and weighted average of 14.1%, a difference of 36.7%.
Male Disability Correlation Summary
| Measurement | Mongolian | Ottawa |
| Minimum | 1.1% | 4.1% |
| Maximum | 30.0% | 33.3% |
| Range | 28.9% | 29.3% |
| Mean | 11.3% | 16.9% |
| Median | 10.1% | 16.0% |
| Interquartile 25% (IQ1) | 8.9% | 13.9% |
| Interquartile 75% (IQ3) | 12.8% | 20.7% |
| Interquartile Range (IQR) | 3.9% | 6.8% |
| Standard Deviation (Sample) | 5.7% | 6.4% |
| Standard Deviation (Population) | 5.6% | 6.3% |
Similar Demographics by Male Disability
Demographics Similar to Mongolians by Male Disability
In terms of male disability, the demographic groups most similar to Mongolians are Immigrants from Bangladesh (10.3%, a difference of 0.020%), Immigrants from El Salvador (10.3%, a difference of 0.090%), Turkish (10.3%, a difference of 0.10%), Cambodian (10.3%, a difference of 0.18%), and Immigrants from Peru (10.3%, a difference of 0.22%).
| Demographics | Rating | Rank | Male Disability |
| Immigrants | Argentina | 99.9 /100 | #35 | Exceptional 10.2% |
| Ethiopians | 99.8 /100 | #36 | Exceptional 10.2% |
| Immigrants | Indonesia | 99.8 /100 | #37 | Exceptional 10.2% |
| Immigrants | Kuwait | 99.8 /100 | #38 | Exceptional 10.2% |
| Afghans | 99.8 /100 | #39 | Exceptional 10.2% |
| Immigrants | Nepal | 99.8 /100 | #40 | Exceptional 10.3% |
| Taiwanese | 99.8 /100 | #41 | Exceptional 10.3% |
| Mongolians | 99.7 /100 | #42 | Exceptional 10.3% |
| Immigrants | Bangladesh | 99.7 /100 | #43 | Exceptional 10.3% |
| Immigrants | El Salvador | 99.7 /100 | #44 | Exceptional 10.3% |
| Turks | 99.7 /100 | #45 | Exceptional 10.3% |
| Cambodians | 99.7 /100 | #46 | Exceptional 10.3% |
| Immigrants | Peru | 99.7 /100 | #47 | Exceptional 10.3% |
| Israelis | 99.7 /100 | #48 | Exceptional 10.3% |
| Immigrants | Spain | 99.7 /100 | #49 | Exceptional 10.3% |
Demographics Similar to Ottawa by Male Disability
In terms of male disability, the demographic groups most similar to Ottawa are Comanche (14.1%, a difference of 0.11%), Osage (14.0%, a difference of 0.44%), Apache (14.0%, a difference of 0.51%), Native/Alaskan (14.2%, a difference of 0.94%), and Potawatomi (14.2%, a difference of 1.1%).
| Demographics | Rating | Rank | Male Disability |
| Cree | 0.0 /100 | #318 | Tragic 13.7% |
| Americans | 0.0 /100 | #319 | Tragic 13.8% |
| Tlingit-Haida | 0.0 /100 | #320 | Tragic 13.8% |
| Shoshone | 0.0 /100 | #321 | Tragic 13.8% |
| Apache | 0.0 /100 | #322 | Tragic 14.0% |
| Osage | 0.0 /100 | #323 | Tragic 14.0% |
| Comanche | 0.0 /100 | #324 | Tragic 14.1% |
| Ottawa | 0.0 /100 | #325 | Tragic 14.1% |
| Natives/Alaskans | 0.0 /100 | #326 | Tragic 14.2% |
| Potawatomi | 0.0 /100 | #327 | Tragic 14.2% |
| Chippewa | 0.0 /100 | #328 | Tragic 14.3% |
| Cajuns | 0.0 /100 | #329 | Tragic 14.4% |
| Navajo | 0.0 /100 | #330 | Tragic 14.4% |
| Tohono O'odham | 0.0 /100 | #331 | Tragic 14.6% |
| Seminole | 0.0 /100 | #332 | Tragic 14.7% |