Cree vs Immigrants from Australia Male Disability
COMPARE
Cree
Immigrants from Australia
Male Disability
Male Disability Comparison
Cree
Immigrants from Australia
13.7%
MALE DISABILITY
0.0/ 100
METRIC RATING
318th/ 347
METRIC RANK
10.4%
MALE DISABILITY
99.5/ 100
METRIC RATING
59th/ 347
METRIC RANK
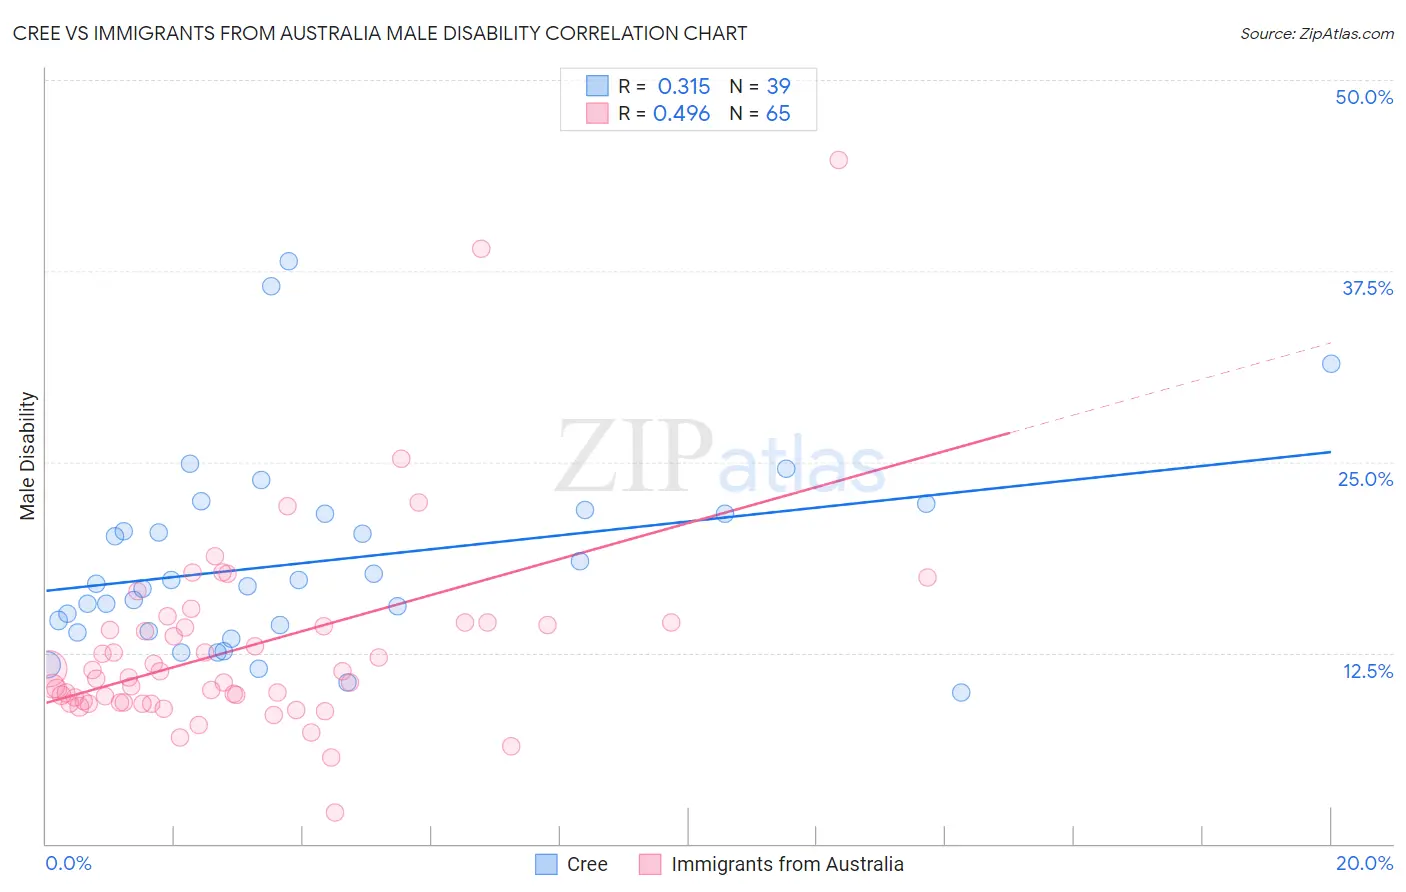
Cree vs Immigrants from Australia Male Disability Correlation Chart
The statistical analysis conducted on geographies consisting of 76,208,606 people shows a mild positive correlation between the proportion of Cree and percentage of males with a disability in the United States with a correlation coefficient (R) of 0.315 and weighted average of 13.7%. Similarly, the statistical analysis conducted on geographies consisting of 227,204,405 people shows a moderate positive correlation between the proportion of Immigrants from Australia and percentage of males with a disability in the United States with a correlation coefficient (R) of 0.496 and weighted average of 10.4%, a difference of 31.9%.
Male Disability Correlation Summary
| Measurement | Cree | Immigrants from Australia |
| Minimum | 9.9% | 2.0% |
| Maximum | 38.1% | 44.7% |
| Range | 28.2% | 42.7% |
| Mean | 18.5% | 12.8% |
| Median | 17.0% | 10.9% |
| Interquartile 25% (IQ1) | 13.9% | 9.2% |
| Interquartile 75% (IQ3) | 21.6% | 14.4% |
| Interquartile Range (IQR) | 7.7% | 5.2% |
| Standard Deviation (Sample) | 6.4% | 6.6% |
| Standard Deviation (Population) | 6.3% | 6.6% |
Similar Demographics by Male Disability
Demographics Similar to Cree by Male Disability
In terms of male disability, the demographic groups most similar to Cree are Paiute (13.7%, a difference of 0.21%), American (13.8%, a difference of 0.41%), Tlingit-Haida (13.8%, a difference of 0.90%), Shoshone (13.8%, a difference of 0.96%), and Alaska Native (13.6%, a difference of 1.0%).
| Demographics | Rating | Rank | Male Disability |
| Delaware | 0.0 /100 | #311 | Tragic 13.5% |
| Yakama | 0.0 /100 | #312 | Tragic 13.5% |
| Puget Sound Salish | 0.0 /100 | #313 | Tragic 13.5% |
| Aleuts | 0.0 /100 | #314 | Tragic 13.5% |
| Iroquois | 0.0 /100 | #315 | Tragic 13.6% |
| Alaska Natives | 0.0 /100 | #316 | Tragic 13.6% |
| Paiute | 0.0 /100 | #317 | Tragic 13.7% |
| Cree | 0.0 /100 | #318 | Tragic 13.7% |
| Americans | 0.0 /100 | #319 | Tragic 13.8% |
| Tlingit-Haida | 0.0 /100 | #320 | Tragic 13.8% |
| Shoshone | 0.0 /100 | #321 | Tragic 13.8% |
| Apache | 0.0 /100 | #322 | Tragic 14.0% |
| Osage | 0.0 /100 | #323 | Tragic 14.0% |
| Comanche | 0.0 /100 | #324 | Tragic 14.1% |
| Ottawa | 0.0 /100 | #325 | Tragic 14.1% |
Demographics Similar to Immigrants from Australia by Male Disability
In terms of male disability, the demographic groups most similar to Immigrants from Australia are Immigrants from Colombia (10.4%, a difference of 0.060%), Immigrants from Japan (10.4%, a difference of 0.14%), Immigrants from Northern Africa (10.4%, a difference of 0.15%), Immigrants from South America (10.4%, a difference of 0.22%), and Tongan (10.4%, a difference of 0.24%).
| Demographics | Rating | Rank | Male Disability |
| Immigrants | Saudi Arabia | 99.6 /100 | #52 | Exceptional 10.4% |
| Immigrants | Uzbekistan | 99.6 /100 | #53 | Exceptional 10.4% |
| Peruvians | 99.6 /100 | #54 | Exceptional 10.4% |
| Immigrants | Eritrea | 99.6 /100 | #55 | Exceptional 10.4% |
| Tongans | 99.6 /100 | #56 | Exceptional 10.4% |
| Immigrants | South America | 99.6 /100 | #57 | Exceptional 10.4% |
| Immigrants | Japan | 99.5 /100 | #58 | Exceptional 10.4% |
| Immigrants | Australia | 99.5 /100 | #59 | Exceptional 10.4% |
| Immigrants | Colombia | 99.5 /100 | #60 | Exceptional 10.4% |
| Immigrants | Northern Africa | 99.4 /100 | #61 | Exceptional 10.4% |
| Immigrants | Ecuador | 99.3 /100 | #62 | Exceptional 10.4% |
| Immigrants | Belarus | 99.3 /100 | #63 | Exceptional 10.4% |
| Jordanians | 99.3 /100 | #64 | Exceptional 10.5% |
| Immigrants | Grenada | 99.2 /100 | #65 | Exceptional 10.5% |
| Guyanese | 99.2 /100 | #66 | Exceptional 10.5% |