Immigrants from Iran vs Dominican Cognitive Disability
COMPARE
Immigrants from Iran
Dominican
Cognitive Disability
Cognitive Disability Comparison
Immigrants from Iran
Dominicans
16.5%
COGNITIVE DISABILITY
99.8/ 100
METRIC RATING
54th/ 347
METRIC RANK
18.7%
COGNITIVE DISABILITY
0.0/ 100
METRIC RATING
324th/ 347
METRIC RANK
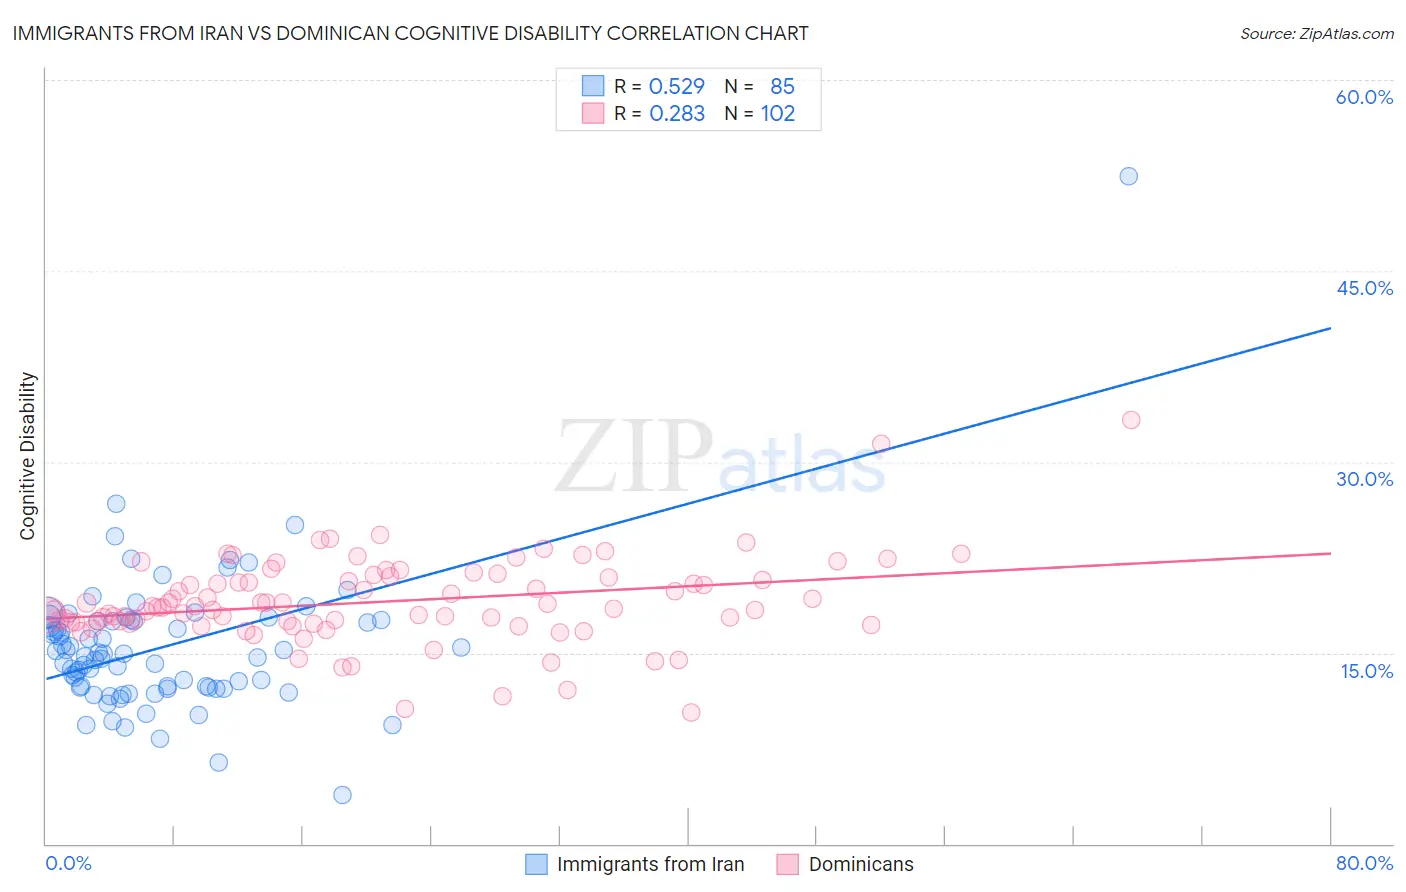
Immigrants from Iran vs Dominican Cognitive Disability Correlation Chart
The statistical analysis conducted on geographies consisting of 279,837,445 people shows a substantial positive correlation between the proportion of Immigrants from Iran and percentage of population with cognitive disability in the United States with a correlation coefficient (R) of 0.529 and weighted average of 16.5%. Similarly, the statistical analysis conducted on geographies consisting of 355,056,669 people shows a weak positive correlation between the proportion of Dominicans and percentage of population with cognitive disability in the United States with a correlation coefficient (R) of 0.283 and weighted average of 18.7%, a difference of 13.0%.
Cognitive Disability Correlation Summary
| Measurement | Immigrants from Iran | Dominican |
| Minimum | 3.9% | 10.3% |
| Maximum | 52.5% | 33.3% |
| Range | 48.6% | 23.0% |
| Mean | 15.5% | 19.0% |
| Median | 14.9% | 18.6% |
| Interquartile 25% (IQ1) | 12.3% | 17.4% |
| Interquartile 75% (IQ3) | 17.5% | 21.0% |
| Interquartile Range (IQR) | 5.3% | 3.6% |
| Standard Deviation (Sample) | 5.7% | 3.4% |
| Standard Deviation (Population) | 5.7% | 3.4% |
Similar Demographics by Cognitive Disability
Demographics Similar to Immigrants from Iran by Cognitive Disability
In terms of cognitive disability, the demographic groups most similar to Immigrants from Iran are Swedish (16.5%, a difference of 0.040%), Immigrants from Venezuela (16.5%, a difference of 0.090%), Soviet Union (16.5%, a difference of 0.10%), Immigrants from Korea (16.5%, a difference of 0.14%), and Austrian (16.6%, a difference of 0.18%).
| Demographics | Rating | Rank | Cognitive Disability |
| Immigrants | Italy | 99.8 /100 | #47 | Exceptional 16.5% |
| Immigrants | North America | 99.8 /100 | #48 | Exceptional 16.5% |
| Iranians | 99.8 /100 | #49 | Exceptional 16.5% |
| Norwegians | 99.8 /100 | #50 | Exceptional 16.5% |
| Immigrants | Korea | 99.8 /100 | #51 | Exceptional 16.5% |
| Soviet Union | 99.8 /100 | #52 | Exceptional 16.5% |
| Swedes | 99.8 /100 | #53 | Exceptional 16.5% |
| Immigrants | Iran | 99.8 /100 | #54 | Exceptional 16.5% |
| Immigrants | Venezuela | 99.7 /100 | #55 | Exceptional 16.5% |
| Austrians | 99.7 /100 | #56 | Exceptional 16.6% |
| Bhutanese | 99.7 /100 | #57 | Exceptional 16.6% |
| Pennsylvania Germans | 99.7 /100 | #58 | Exceptional 16.6% |
| Immigrants | Peru | 99.7 /100 | #59 | Exceptional 16.6% |
| Romanians | 99.7 /100 | #60 | Exceptional 16.6% |
| Immigrants | England | 99.6 /100 | #61 | Exceptional 16.6% |
Demographics Similar to Dominicans by Cognitive Disability
In terms of cognitive disability, the demographic groups most similar to Dominicans are Indonesian (18.7%, a difference of 0.080%), Immigrants from Senegal (18.7%, a difference of 0.10%), Pueblo (18.7%, a difference of 0.12%), Immigrants from Liberia (18.7%, a difference of 0.14%), and U.S. Virgin Islander (18.7%, a difference of 0.14%).
| Demographics | Rating | Rank | Cognitive Disability |
| Liberians | 0.0 /100 | #317 | Tragic 18.6% |
| Bangladeshis | 0.0 /100 | #318 | Tragic 18.6% |
| Comanche | 0.0 /100 | #319 | Tragic 18.6% |
| Apache | 0.0 /100 | #320 | Tragic 18.6% |
| Africans | 0.0 /100 | #321 | Tragic 18.6% |
| Immigrants | Liberia | 0.0 /100 | #322 | Tragic 18.7% |
| Pueblo | 0.0 /100 | #323 | Tragic 18.7% |
| Dominicans | 0.0 /100 | #324 | Tragic 18.7% |
| Indonesians | 0.0 /100 | #325 | Tragic 18.7% |
| Immigrants | Senegal | 0.0 /100 | #326 | Tragic 18.7% |
| U.S. Virgin Islanders | 0.0 /100 | #327 | Tragic 18.7% |
| Kiowa | 0.0 /100 | #328 | Tragic 18.7% |
| Navajo | 0.0 /100 | #329 | Tragic 18.8% |
| Immigrants | Dominican Republic | 0.0 /100 | #330 | Tragic 18.8% |
| Pima | 0.0 /100 | #331 | Tragic 18.8% |