Chinese vs Dominican Cognitive Disability
COMPARE
Chinese
Dominican
Cognitive Disability
Cognitive Disability Comparison
Chinese
Dominicans
15.9%
COGNITIVE DISABILITY
100.0/ 100
METRIC RATING
3rd/ 347
METRIC RANK
18.7%
COGNITIVE DISABILITY
0.0/ 100
METRIC RATING
324th/ 347
METRIC RANK
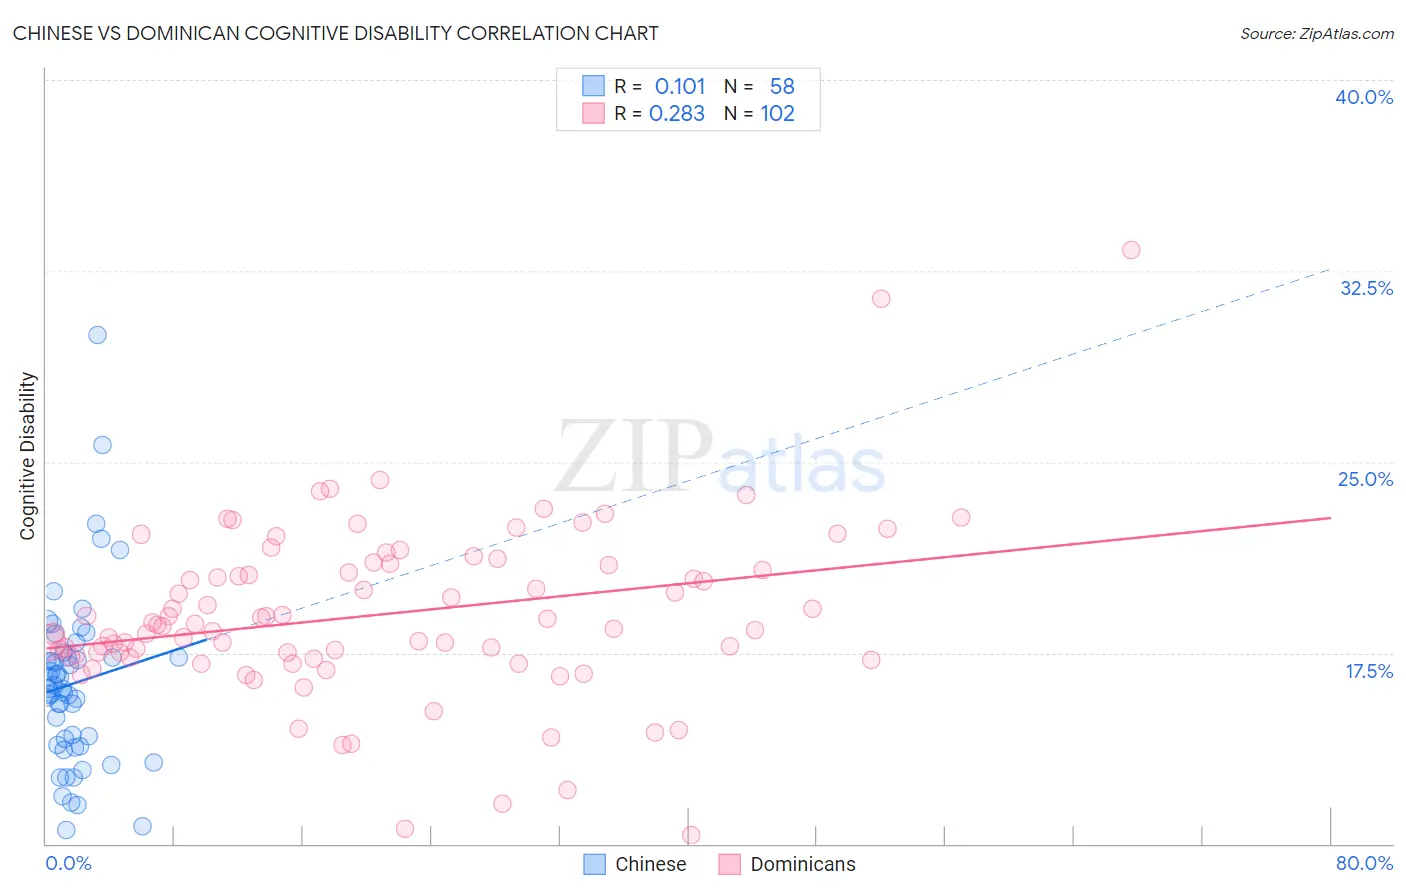
Chinese vs Dominican Cognitive Disability Correlation Chart
The statistical analysis conducted on geographies consisting of 64,802,428 people shows a poor positive correlation between the proportion of Chinese and percentage of population with cognitive disability in the United States with a correlation coefficient (R) of 0.101 and weighted average of 15.9%. Similarly, the statistical analysis conducted on geographies consisting of 355,056,669 people shows a weak positive correlation between the proportion of Dominicans and percentage of population with cognitive disability in the United States with a correlation coefficient (R) of 0.283 and weighted average of 18.7%, a difference of 17.3%.
Cognitive Disability Correlation Summary
| Measurement | Chinese | Dominican |
| Minimum | 10.5% | 10.3% |
| Maximum | 30.0% | 33.3% |
| Range | 19.5% | 23.0% |
| Mean | 16.3% | 19.0% |
| Median | 16.1% | 18.6% |
| Interquartile 25% (IQ1) | 13.9% | 17.4% |
| Interquartile 75% (IQ3) | 17.3% | 21.0% |
| Interquartile Range (IQR) | 3.4% | 3.6% |
| Standard Deviation (Sample) | 3.4% | 3.4% |
| Standard Deviation (Population) | 3.4% | 3.4% |
Similar Demographics by Cognitive Disability
Demographics Similar to Chinese by Cognitive Disability
In terms of cognitive disability, the demographic groups most similar to Chinese are Immigrants from India (15.9%, a difference of 0.080%), Immigrants from Lithuania (16.0%, a difference of 0.18%), Immigrants from Hong Kong (16.0%, a difference of 0.59%), Thai (16.1%, a difference of 1.2%), and Immigrants from Ireland (16.1%, a difference of 1.3%).
| Demographics | Rating | Rank | Cognitive Disability |
| Immigrants | Taiwan | 100.0 /100 | #1 | Exceptional 15.7% |
| Immigrants | India | 100.0 /100 | #2 | Exceptional 15.9% |
| Chinese | 100.0 /100 | #3 | Exceptional 15.9% |
| Immigrants | Lithuania | 100.0 /100 | #4 | Exceptional 16.0% |
| Immigrants | Hong Kong | 100.0 /100 | #5 | Exceptional 16.0% |
| Thais | 100.0 /100 | #6 | Exceptional 16.1% |
| Immigrants | Ireland | 100.0 /100 | #7 | Exceptional 16.1% |
| Immigrants | Poland | 100.0 /100 | #8 | Exceptional 16.1% |
| Assyrians/Chaldeans/Syriacs | 100.0 /100 | #9 | Exceptional 16.2% |
| Immigrants | Scotland | 100.0 /100 | #10 | Exceptional 16.2% |
| Immigrants | Czechoslovakia | 100.0 /100 | #11 | Exceptional 16.2% |
| Maltese | 100.0 /100 | #12 | Exceptional 16.2% |
| Lithuanians | 100.0 /100 | #13 | Exceptional 16.3% |
| Immigrants | Austria | 100.0 /100 | #14 | Exceptional 16.3% |
| Immigrants | Greece | 100.0 /100 | #15 | Exceptional 16.3% |
Demographics Similar to Dominicans by Cognitive Disability
In terms of cognitive disability, the demographic groups most similar to Dominicans are Indonesian (18.7%, a difference of 0.080%), Immigrants from Senegal (18.7%, a difference of 0.10%), Pueblo (18.7%, a difference of 0.12%), Immigrants from Liberia (18.7%, a difference of 0.14%), and U.S. Virgin Islander (18.7%, a difference of 0.14%).
| Demographics | Rating | Rank | Cognitive Disability |
| Liberians | 0.0 /100 | #317 | Tragic 18.6% |
| Bangladeshis | 0.0 /100 | #318 | Tragic 18.6% |
| Comanche | 0.0 /100 | #319 | Tragic 18.6% |
| Apache | 0.0 /100 | #320 | Tragic 18.6% |
| Africans | 0.0 /100 | #321 | Tragic 18.6% |
| Immigrants | Liberia | 0.0 /100 | #322 | Tragic 18.7% |
| Pueblo | 0.0 /100 | #323 | Tragic 18.7% |
| Dominicans | 0.0 /100 | #324 | Tragic 18.7% |
| Indonesians | 0.0 /100 | #325 | Tragic 18.7% |
| Immigrants | Senegal | 0.0 /100 | #326 | Tragic 18.7% |
| U.S. Virgin Islanders | 0.0 /100 | #327 | Tragic 18.7% |
| Kiowa | 0.0 /100 | #328 | Tragic 18.7% |
| Navajo | 0.0 /100 | #329 | Tragic 18.8% |
| Immigrants | Dominican Republic | 0.0 /100 | #330 | Tragic 18.8% |
| Pima | 0.0 /100 | #331 | Tragic 18.8% |