Welsh vs Immigrants from Netherlands Cognitive Disability
COMPARE
Welsh
Immigrants from Netherlands
Cognitive Disability
Cognitive Disability Comparison
Welsh
Immigrants from Netherlands
17.0%
COGNITIVE DISABILITY
90.8/ 100
METRIC RATING
138th/ 347
METRIC RANK
16.7%
COGNITIVE DISABILITY
99.2/ 100
METRIC RATING
81st/ 347
METRIC RANK
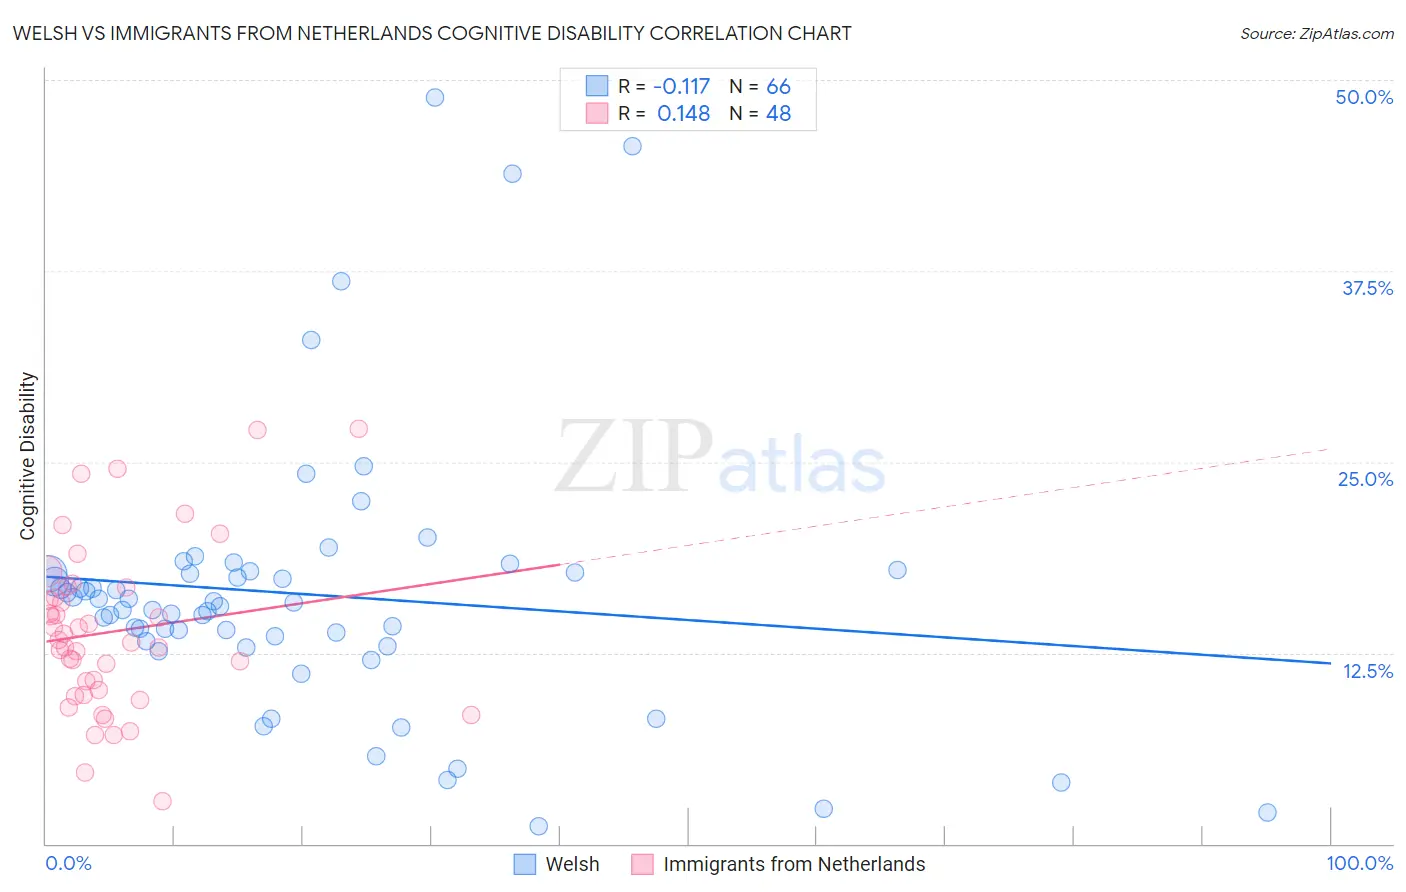
Welsh vs Immigrants from Netherlands Cognitive Disability Correlation Chart
The statistical analysis conducted on geographies consisting of 528,521,772 people shows a poor negative correlation between the proportion of Welsh and percentage of population with cognitive disability in the United States with a correlation coefficient (R) of -0.117 and weighted average of 17.0%. Similarly, the statistical analysis conducted on geographies consisting of 237,879,934 people shows a poor positive correlation between the proportion of Immigrants from Netherlands and percentage of population with cognitive disability in the United States with a correlation coefficient (R) of 0.148 and weighted average of 16.7%, a difference of 1.9%.
Cognitive Disability Correlation Summary
| Measurement | Welsh | Immigrants from Netherlands |
| Minimum | 1.2% | 2.7% |
| Maximum | 48.8% | 27.2% |
| Range | 47.7% | 24.4% |
| Mean | 16.3% | 13.9% |
| Median | 15.7% | 13.3% |
| Interquartile 25% (IQ1) | 13.2% | 9.9% |
| Interquartile 75% (IQ3) | 17.8% | 16.5% |
| Interquartile Range (IQR) | 4.5% | 6.6% |
| Standard Deviation (Sample) | 8.9% | 5.4% |
| Standard Deviation (Population) | 8.9% | 5.4% |
Similar Demographics by Cognitive Disability
Demographics Similar to Welsh by Cognitive Disability
In terms of cognitive disability, the demographic groups most similar to Welsh are Israeli (17.0%, a difference of 0.020%), Immigrants from Norway (17.0%, a difference of 0.020%), Lebanese (17.0%, a difference of 0.050%), French (17.0%, a difference of 0.070%), and Chilean (17.0%, a difference of 0.070%).
| Demographics | Rating | Rank | Cognitive Disability |
| Immigrants | Germany | 92.1 /100 | #131 | Exceptional 17.0% |
| Whites/Caucasians | 92.1 /100 | #132 | Exceptional 17.0% |
| Immigrants | Jordan | 91.9 /100 | #133 | Exceptional 17.0% |
| Immigrants | Chile | 91.7 /100 | #134 | Exceptional 17.0% |
| Lebanese | 91.3 /100 | #135 | Exceptional 17.0% |
| Israelis | 91.0 /100 | #136 | Exceptional 17.0% |
| Immigrants | Norway | 90.9 /100 | #137 | Exceptional 17.0% |
| Welsh | 90.8 /100 | #138 | Exceptional 17.0% |
| French | 90.0 /100 | #139 | Excellent 17.0% |
| Chileans | 89.9 /100 | #140 | Excellent 17.0% |
| Aleuts | 89.9 /100 | #141 | Excellent 17.0% |
| Carpatho Rusyns | 89.6 /100 | #142 | Excellent 17.0% |
| British | 89.3 /100 | #143 | Excellent 17.0% |
| Immigrants | Brazil | 89.3 /100 | #144 | Excellent 17.0% |
| Immigrants | South Eastern Asia | 88.7 /100 | #145 | Excellent 17.0% |
Demographics Similar to Immigrants from Netherlands by Cognitive Disability
In terms of cognitive disability, the demographic groups most similar to Immigrants from Netherlands are Egyptian (16.7%, a difference of 0.010%), Swiss (16.7%, a difference of 0.030%), Peruvian (16.7%, a difference of 0.040%), Immigrants from Bulgaria (16.7%, a difference of 0.040%), and Immigrants from Hungary (16.7%, a difference of 0.050%).
| Demographics | Rating | Rank | Cognitive Disability |
| Slavs | 99.3 /100 | #74 | Exceptional 16.7% |
| Estonians | 99.3 /100 | #75 | Exceptional 16.7% |
| Immigrants | Serbia | 99.3 /100 | #76 | Exceptional 16.7% |
| Immigrants | Hungary | 99.3 /100 | #77 | Exceptional 16.7% |
| Peruvians | 99.3 /100 | #78 | Exceptional 16.7% |
| Immigrants | Bulgaria | 99.3 /100 | #79 | Exceptional 16.7% |
| Egyptians | 99.2 /100 | #80 | Exceptional 16.7% |
| Immigrants | Netherlands | 99.2 /100 | #81 | Exceptional 16.7% |
| Swiss | 99.2 /100 | #82 | Exceptional 16.7% |
| Serbians | 99.1 /100 | #83 | Exceptional 16.7% |
| Belgians | 99.1 /100 | #84 | Exceptional 16.7% |
| Immigrants | Moldova | 99.1 /100 | #85 | Exceptional 16.7% |
| Immigrants | South Africa | 99.0 /100 | #86 | Exceptional 16.7% |
| Native Hawaiians | 99.0 /100 | #87 | Exceptional 16.7% |
| Immigrants | Philippines | 99.0 /100 | #88 | Exceptional 16.7% |