Welsh vs Cherokee Cognitive Disability
COMPARE
Welsh
Cherokee
Cognitive Disability
Cognitive Disability Comparison
Welsh
Cherokee
17.0%
COGNITIVE DISABILITY
90.8/ 100
METRIC RATING
138th/ 347
METRIC RANK
18.0%
COGNITIVE DISABILITY
0.3/ 100
METRIC RATING
268th/ 347
METRIC RANK
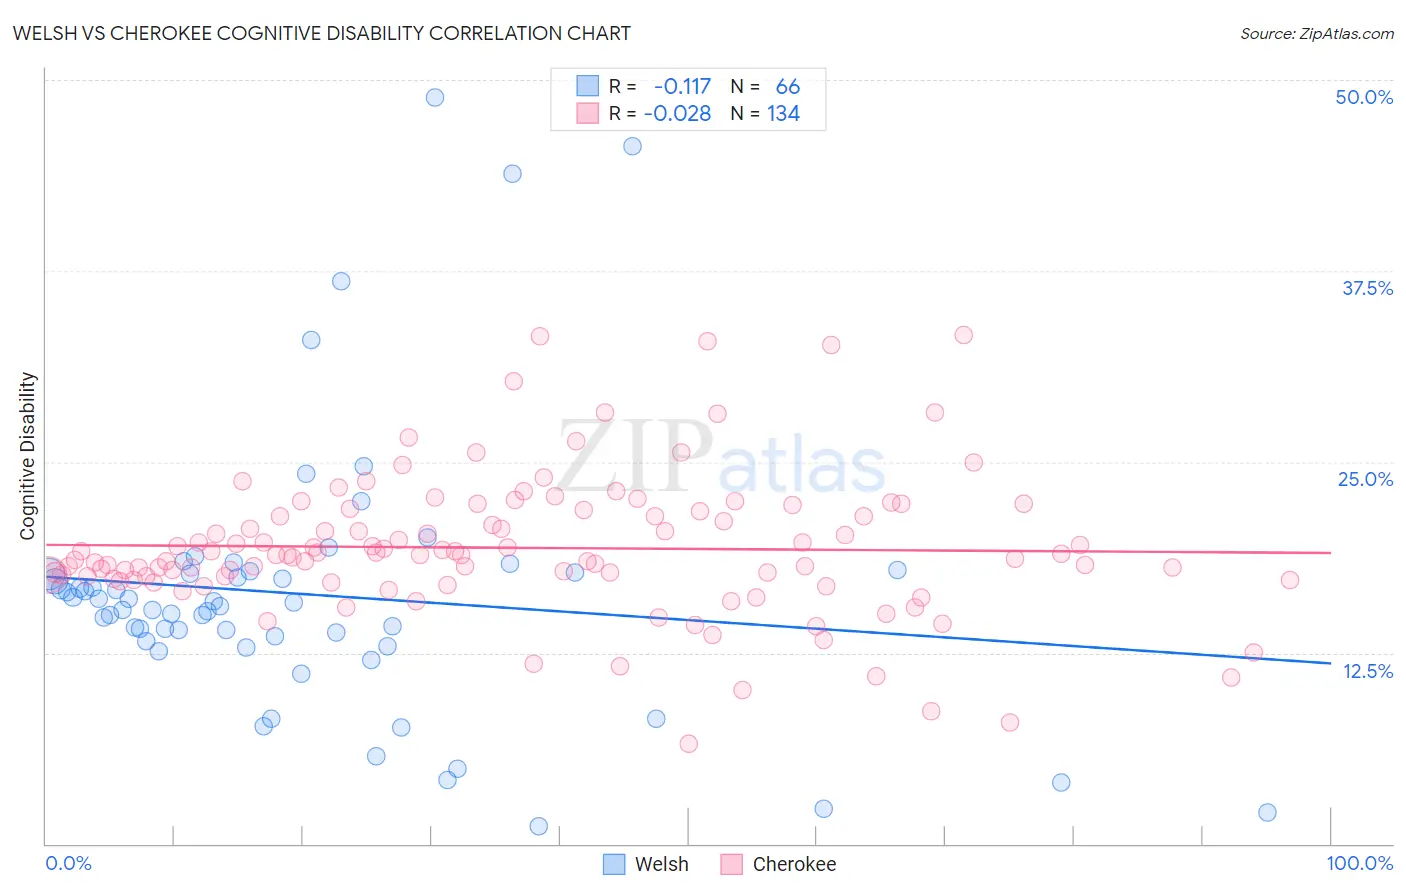
Welsh vs Cherokee Cognitive Disability Correlation Chart
The statistical analysis conducted on geographies consisting of 528,521,772 people shows a poor negative correlation between the proportion of Welsh and percentage of population with cognitive disability in the United States with a correlation coefficient (R) of -0.117 and weighted average of 17.0%. Similarly, the statistical analysis conducted on geographies consisting of 493,579,775 people shows no correlation between the proportion of Cherokee and percentage of population with cognitive disability in the United States with a correlation coefficient (R) of -0.028 and weighted average of 18.0%, a difference of 5.8%.
Cognitive Disability Correlation Summary
| Measurement | Welsh | Cherokee |
| Minimum | 1.2% | 6.5% |
| Maximum | 48.8% | 33.3% |
| Range | 47.7% | 26.8% |
| Mean | 16.3% | 19.4% |
| Median | 15.7% | 18.9% |
| Interquartile 25% (IQ1) | 13.2% | 17.4% |
| Interquartile 75% (IQ3) | 17.8% | 21.8% |
| Interquartile Range (IQR) | 4.5% | 4.4% |
| Standard Deviation (Sample) | 8.9% | 4.6% |
| Standard Deviation (Population) | 8.9% | 4.6% |
Similar Demographics by Cognitive Disability
Demographics Similar to Welsh by Cognitive Disability
In terms of cognitive disability, the demographic groups most similar to Welsh are Israeli (17.0%, a difference of 0.020%), Immigrants from Norway (17.0%, a difference of 0.020%), Lebanese (17.0%, a difference of 0.050%), French (17.0%, a difference of 0.070%), and Chilean (17.0%, a difference of 0.070%).
| Demographics | Rating | Rank | Cognitive Disability |
| Immigrants | Germany | 92.1 /100 | #131 | Exceptional 17.0% |
| Whites/Caucasians | 92.1 /100 | #132 | Exceptional 17.0% |
| Immigrants | Jordan | 91.9 /100 | #133 | Exceptional 17.0% |
| Immigrants | Chile | 91.7 /100 | #134 | Exceptional 17.0% |
| Lebanese | 91.3 /100 | #135 | Exceptional 17.0% |
| Israelis | 91.0 /100 | #136 | Exceptional 17.0% |
| Immigrants | Norway | 90.9 /100 | #137 | Exceptional 17.0% |
| Welsh | 90.8 /100 | #138 | Exceptional 17.0% |
| French | 90.0 /100 | #139 | Excellent 17.0% |
| Chileans | 89.9 /100 | #140 | Excellent 17.0% |
| Aleuts | 89.9 /100 | #141 | Excellent 17.0% |
| Carpatho Rusyns | 89.6 /100 | #142 | Excellent 17.0% |
| British | 89.3 /100 | #143 | Excellent 17.0% |
| Immigrants | Brazil | 89.3 /100 | #144 | Excellent 17.0% |
| Immigrants | South Eastern Asia | 88.7 /100 | #145 | Excellent 17.0% |
Demographics Similar to Cherokee by Cognitive Disability
In terms of cognitive disability, the demographic groups most similar to Cherokee are Nepalese (18.0%, a difference of 0.010%), Spanish American (18.0%, a difference of 0.070%), Belizean (18.0%, a difference of 0.070%), Menominee (18.0%, a difference of 0.10%), and Honduran (18.0%, a difference of 0.14%).
| Demographics | Rating | Rank | Cognitive Disability |
| Guamanians/Chamorros | 0.5 /100 | #261 | Tragic 17.9% |
| Sierra Leoneans | 0.4 /100 | #262 | Tragic 17.9% |
| Immigrants | Barbados | 0.4 /100 | #263 | Tragic 17.9% |
| Menominee | 0.4 /100 | #264 | Tragic 18.0% |
| Spanish Americans | 0.4 /100 | #265 | Tragic 18.0% |
| Belizeans | 0.4 /100 | #266 | Tragic 18.0% |
| Nepalese | 0.3 /100 | #267 | Tragic 18.0% |
| Cherokee | 0.3 /100 | #268 | Tragic 18.0% |
| Hondurans | 0.3 /100 | #269 | Tragic 18.0% |
| Immigrants | Bahamas | 0.3 /100 | #270 | Tragic 18.0% |
| Potawatomi | 0.2 /100 | #271 | Tragic 18.0% |
| Immigrants | Honduras | 0.2 /100 | #272 | Tragic 18.0% |
| Immigrants | Nepal | 0.2 /100 | #273 | Tragic 18.0% |
| Immigrants | Nigeria | 0.2 /100 | #274 | Tragic 18.0% |
| Immigrants | Laos | 0.2 /100 | #275 | Tragic 18.1% |