Alaskan Athabascan vs Dominican Cognitive Disability
COMPARE
Alaskan Athabascan
Dominican
Cognitive Disability
Cognitive Disability Comparison
Alaskan Athabascans
Dominicans
17.6%
COGNITIVE DISABILITY
6.9/ 100
METRIC RATING
215th/ 347
METRIC RANK
18.7%
COGNITIVE DISABILITY
0.0/ 100
METRIC RATING
324th/ 347
METRIC RANK
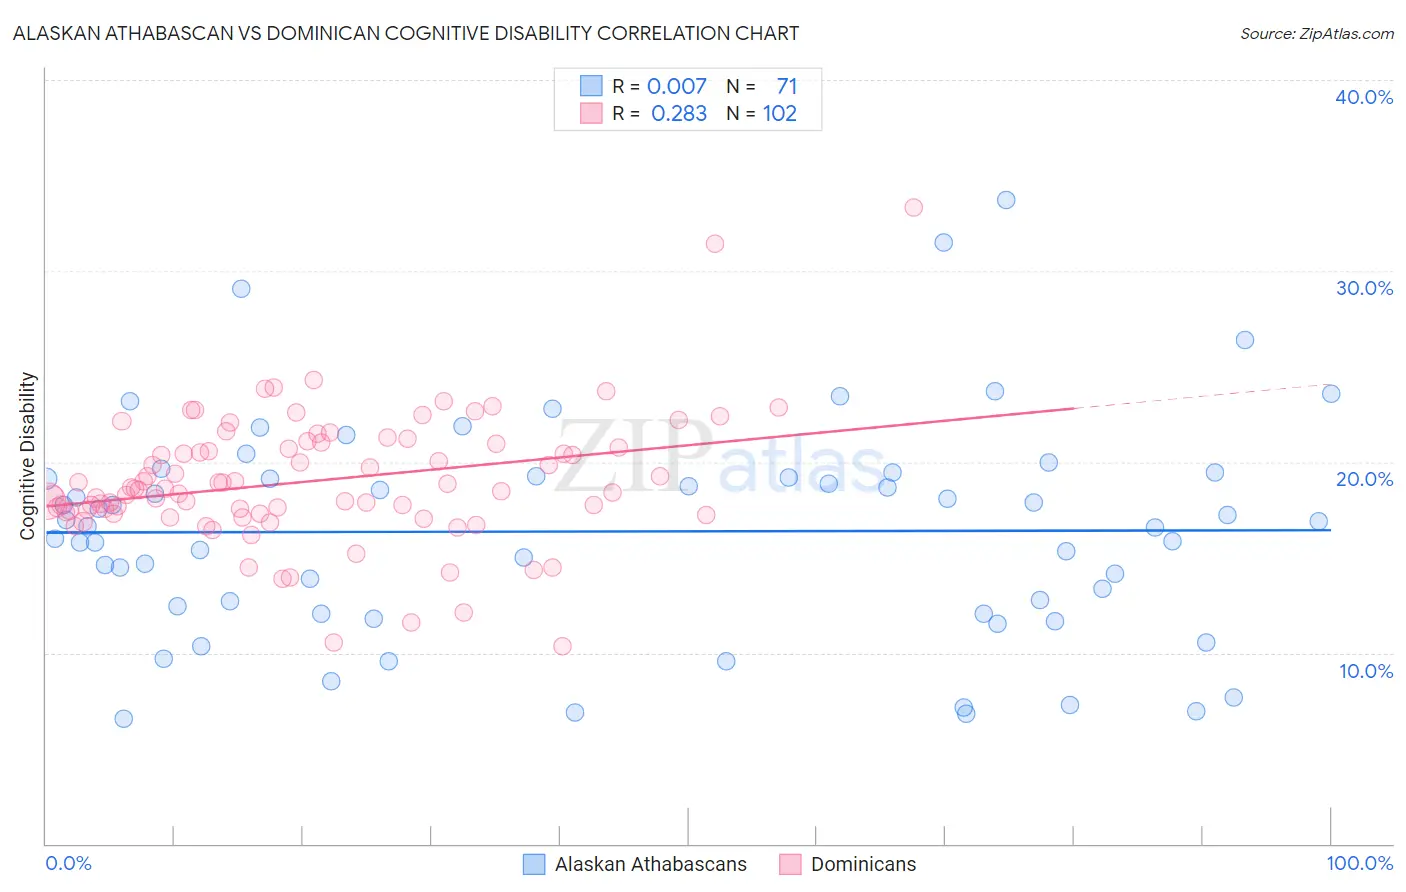
Alaskan Athabascan vs Dominican Cognitive Disability Correlation Chart
The statistical analysis conducted on geographies consisting of 45,820,962 people shows no correlation between the proportion of Alaskan Athabascans and percentage of population with cognitive disability in the United States with a correlation coefficient (R) of 0.007 and weighted average of 17.6%. Similarly, the statistical analysis conducted on geographies consisting of 355,056,669 people shows a weak positive correlation between the proportion of Dominicans and percentage of population with cognitive disability in the United States with a correlation coefficient (R) of 0.283 and weighted average of 18.7%, a difference of 6.1%.
Cognitive Disability Correlation Summary
| Measurement | Alaskan Athabascan | Dominican |
| Minimum | 6.5% | 10.3% |
| Maximum | 33.7% | 33.3% |
| Range | 27.2% | 23.0% |
| Mean | 16.4% | 19.0% |
| Median | 16.6% | 18.6% |
| Interquartile 25% (IQ1) | 12.1% | 17.4% |
| Interquartile 75% (IQ3) | 19.2% | 21.0% |
| Interquartile Range (IQR) | 7.2% | 3.6% |
| Standard Deviation (Sample) | 5.7% | 3.4% |
| Standard Deviation (Population) | 5.7% | 3.4% |
Similar Demographics by Cognitive Disability
Demographics Similar to Alaskan Athabascans by Cognitive Disability
In terms of cognitive disability, the demographic groups most similar to Alaskan Athabascans are Immigrants from El Salvador (17.6%, a difference of 0.010%), Okinawan (17.6%, a difference of 0.010%), Salvadoran (17.6%, a difference of 0.020%), Hawaiian (17.6%, a difference of 0.030%), and Immigrants from Oceania (17.6%, a difference of 0.050%).
| Demographics | Rating | Rank | Cognitive Disability |
| Immigrants | Cameroon | 9.3 /100 | #208 | Tragic 17.6% |
| Immigrants | Trinidad and Tobago | 8.7 /100 | #209 | Tragic 17.6% |
| Immigrants | Jamaica | 8.5 /100 | #210 | Tragic 17.6% |
| Taiwanese | 7.7 /100 | #211 | Tragic 17.6% |
| Immigrants | Oceania | 7.3 /100 | #212 | Tragic 17.6% |
| Hawaiians | 7.2 /100 | #213 | Tragic 17.6% |
| Immigrants | El Salvador | 7.0 /100 | #214 | Tragic 17.6% |
| Alaskan Athabascans | 6.9 /100 | #215 | Tragic 17.6% |
| Okinawans | 6.8 /100 | #216 | Tragic 17.6% |
| Salvadorans | 6.7 /100 | #217 | Tragic 17.6% |
| Icelanders | 6.4 /100 | #218 | Tragic 17.6% |
| Immigrants | Sierra Leone | 6.3 /100 | #219 | Tragic 17.6% |
| Zimbabweans | 6.1 /100 | #220 | Tragic 17.6% |
| Moroccans | 5.9 /100 | #221 | Tragic 17.6% |
| Central Americans | 4.5 /100 | #222 | Tragic 17.7% |
Demographics Similar to Dominicans by Cognitive Disability
In terms of cognitive disability, the demographic groups most similar to Dominicans are Indonesian (18.7%, a difference of 0.080%), Immigrants from Senegal (18.7%, a difference of 0.10%), Pueblo (18.7%, a difference of 0.12%), Immigrants from Liberia (18.7%, a difference of 0.14%), and U.S. Virgin Islander (18.7%, a difference of 0.14%).
| Demographics | Rating | Rank | Cognitive Disability |
| Liberians | 0.0 /100 | #317 | Tragic 18.6% |
| Bangladeshis | 0.0 /100 | #318 | Tragic 18.6% |
| Comanche | 0.0 /100 | #319 | Tragic 18.6% |
| Apache | 0.0 /100 | #320 | Tragic 18.6% |
| Africans | 0.0 /100 | #321 | Tragic 18.6% |
| Immigrants | Liberia | 0.0 /100 | #322 | Tragic 18.7% |
| Pueblo | 0.0 /100 | #323 | Tragic 18.7% |
| Dominicans | 0.0 /100 | #324 | Tragic 18.7% |
| Indonesians | 0.0 /100 | #325 | Tragic 18.7% |
| Immigrants | Senegal | 0.0 /100 | #326 | Tragic 18.7% |
| U.S. Virgin Islanders | 0.0 /100 | #327 | Tragic 18.7% |
| Kiowa | 0.0 /100 | #328 | Tragic 18.7% |
| Navajo | 0.0 /100 | #329 | Tragic 18.8% |
| Immigrants | Dominican Republic | 0.0 /100 | #330 | Tragic 18.8% |
| Pima | 0.0 /100 | #331 | Tragic 18.8% |