Vietnamese vs South African Male Unemployment
COMPARE
Vietnamese
South African
Male Unemployment
Male Unemployment Comparison
Vietnamese
South Africans
6.6%
MALE UNEMPLOYMENT
0.0/ 100
METRIC RATING
300th/ 347
METRIC RANK
5.0%
MALE UNEMPLOYMENT
96.4/ 100
METRIC RATING
79th/ 347
METRIC RANK
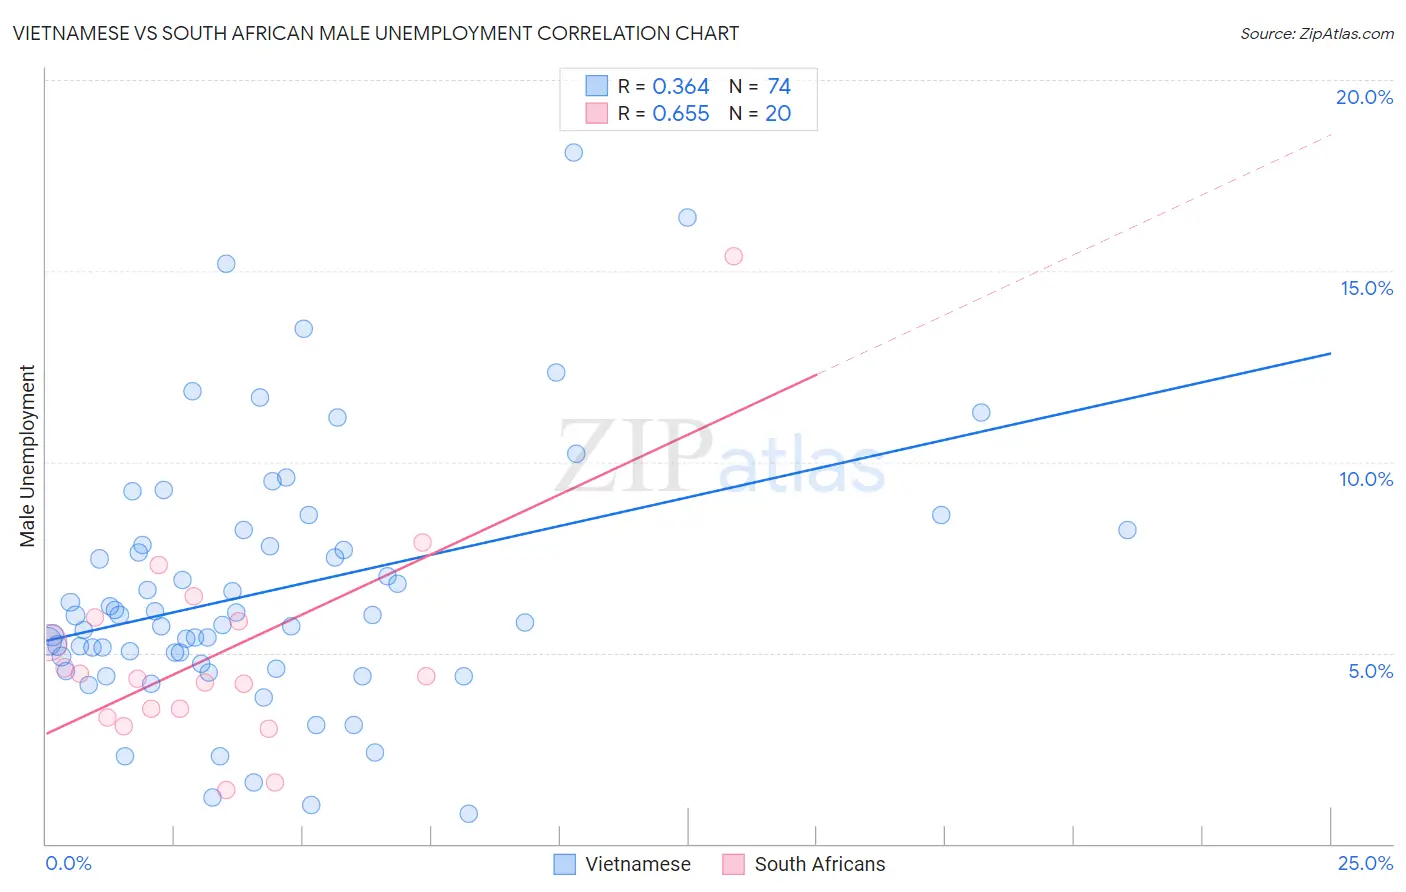
Vietnamese vs South African Male Unemployment Correlation Chart
The statistical analysis conducted on geographies consisting of 170,612,254 people shows a mild positive correlation between the proportion of Vietnamese and unemployment rate among males in the United States with a correlation coefficient (R) of 0.364 and weighted average of 6.6%. Similarly, the statistical analysis conducted on geographies consisting of 182,243,943 people shows a significant positive correlation between the proportion of South Africans and unemployment rate among males in the United States with a correlation coefficient (R) of 0.655 and weighted average of 5.0%, a difference of 30.6%.
Male Unemployment Correlation Summary
| Measurement | Vietnamese | South African |
| Minimum | 0.80% | 1.4% |
| Maximum | 18.1% | 15.4% |
| Range | 17.3% | 14.0% |
| Mean | 6.6% | 5.0% |
| Median | 5.9% | 4.4% |
| Interquartile 25% (IQ1) | 4.7% | 3.4% |
| Interquartile 75% (IQ3) | 7.8% | 5.9% |
| Interquartile Range (IQR) | 3.1% | 2.4% |
| Standard Deviation (Sample) | 3.4% | 3.0% |
| Standard Deviation (Population) | 3.3% | 2.9% |
Similar Demographics by Male Unemployment
Demographics Similar to Vietnamese by Male Unemployment
In terms of male unemployment, the demographic groups most similar to Vietnamese are Immigrants from Belize (6.6%, a difference of 0.11%), Immigrants from Bangladesh (6.6%, a difference of 0.27%), Jamaican (6.6%, a difference of 0.40%), Chippewa (6.6%, a difference of 0.48%), and Immigrants from Haiti (6.5%, a difference of 0.80%).
| Demographics | Rating | Rank | Male Unemployment |
| Haitians | 0.0 /100 | #293 | Tragic 6.4% |
| Senegalese | 0.0 /100 | #294 | Tragic 6.4% |
| Belizeans | 0.0 /100 | #295 | Tragic 6.5% |
| Immigrants | Haiti | 0.0 /100 | #296 | Tragic 6.5% |
| Chippewa | 0.0 /100 | #297 | Tragic 6.6% |
| Jamaicans | 0.0 /100 | #298 | Tragic 6.6% |
| Immigrants | Bangladesh | 0.0 /100 | #299 | Tragic 6.6% |
| Vietnamese | 0.0 /100 | #300 | Tragic 6.6% |
| Immigrants | Belize | 0.0 /100 | #301 | Tragic 6.6% |
| Ute | 0.0 /100 | #302 | Tragic 6.6% |
| Immigrants | West Indies | 0.0 /100 | #303 | Tragic 6.7% |
| West Indians | 0.0 /100 | #304 | Tragic 6.7% |
| Trinidadians and Tobagonians | 0.0 /100 | #305 | Tragic 6.7% |
| Immigrants | Trinidad and Tobago | 0.0 /100 | #306 | Tragic 6.7% |
| Immigrants | Jamaica | 0.0 /100 | #307 | Tragic 6.7% |
Demographics Similar to South Africans by Male Unemployment
In terms of male unemployment, the demographic groups most similar to South Africans are Immigrants from Northern Europe (5.0%, a difference of 0.010%), Iranian (5.0%, a difference of 0.020%), Argentinean (5.0%, a difference of 0.050%), French (5.0%, a difference of 0.050%), and Immigrants from Sudan (5.0%, a difference of 0.070%).
| Demographics | Rating | Rank | Male Unemployment |
| Immigrants | South Africa | 97.1 /100 | #72 | Exceptional 5.0% |
| Greeks | 97.0 /100 | #73 | Exceptional 5.0% |
| Immigrants | North America | 96.9 /100 | #74 | Exceptional 5.0% |
| Assyrians/Chaldeans/Syriacs | 96.9 /100 | #75 | Exceptional 5.0% |
| Immigrants | Sudan | 96.5 /100 | #76 | Exceptional 5.0% |
| Iranians | 96.4 /100 | #77 | Exceptional 5.0% |
| Immigrants | Northern Europe | 96.4 /100 | #78 | Exceptional 5.0% |
| South Africans | 96.4 /100 | #79 | Exceptional 5.0% |
| Argentineans | 96.2 /100 | #80 | Exceptional 5.0% |
| French | 96.2 /100 | #81 | Exceptional 5.0% |
| Chileans | 96.2 /100 | #82 | Exceptional 5.0% |
| Immigrants | Eritrea | 96.0 /100 | #83 | Exceptional 5.0% |
| Serbians | 95.7 /100 | #84 | Exceptional 5.1% |
| Immigrants | North Macedonia | 95.6 /100 | #85 | Exceptional 5.1% |
| Maltese | 95.5 /100 | #86 | Exceptional 5.1% |