Vietnamese vs Immigrants from Belize Disability
COMPARE
Vietnamese
Immigrants from Belize
Disability
Disability Comparison
Vietnamese
Immigrants from Belize
10.9%
DISABILITY
99.9/ 100
METRIC RATING
49th/ 347
METRIC RANK
11.9%
DISABILITY
15.2/ 100
METRIC RATING
197th/ 347
METRIC RANK
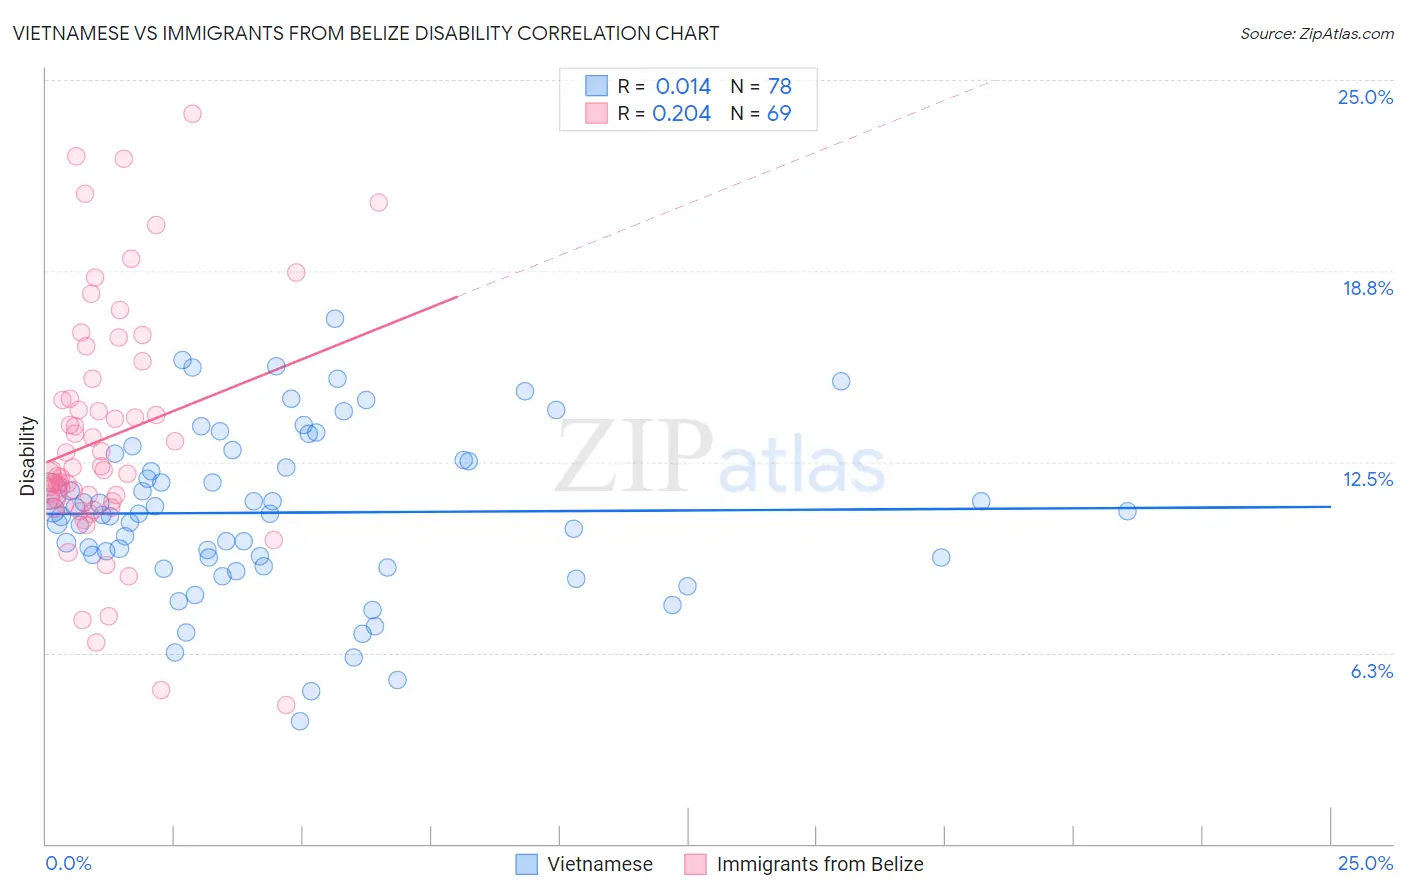
Vietnamese vs Immigrants from Belize Disability Correlation Chart
The statistical analysis conducted on geographies consisting of 170,758,607 people shows no correlation between the proportion of Vietnamese and percentage of population with a disability in the United States with a correlation coefficient (R) of 0.014 and weighted average of 10.9%. Similarly, the statistical analysis conducted on geographies consisting of 130,304,390 people shows a weak positive correlation between the proportion of Immigrants from Belize and percentage of population with a disability in the United States with a correlation coefficient (R) of 0.204 and weighted average of 11.9%, a difference of 9.8%.
Disability Correlation Summary
| Measurement | Vietnamese | Immigrants from Belize |
| Minimum | 4.0% | 4.5% |
| Maximum | 17.2% | 23.9% |
| Range | 13.2% | 19.4% |
| Mean | 10.8% | 13.3% |
| Median | 10.8% | 12.2% |
| Interquartile 25% (IQ1) | 9.4% | 11.2% |
| Interquartile 75% (IQ3) | 12.6% | 14.9% |
| Interquartile Range (IQR) | 3.2% | 3.8% |
| Standard Deviation (Sample) | 2.7% | 4.0% |
| Standard Deviation (Population) | 2.7% | 3.9% |
Similar Demographics by Disability
Demographics Similar to Vietnamese by Disability
In terms of disability, the demographic groups most similar to Vietnamese are Immigrants from Saudi Arabia (10.9%, a difference of 0.0%), Peruvian (10.9%, a difference of 0.010%), Soviet Union (10.9%, a difference of 0.060%), South American (10.9%, a difference of 0.070%), and Immigrants from Spain (10.9%, a difference of 0.090%).
| Demographics | Rating | Rank | Disability |
| Immigrants | Nepal | 99.9 /100 | #42 | Exceptional 10.8% |
| Israelis | 99.9 /100 | #43 | Exceptional 10.8% |
| Immigrants | Japan | 99.9 /100 | #44 | Exceptional 10.8% |
| Immigrants | Peru | 99.9 /100 | #45 | Exceptional 10.8% |
| Tongans | 99.9 /100 | #46 | Exceptional 10.8% |
| Taiwanese | 99.9 /100 | #47 | Exceptional 10.8% |
| Soviet Union | 99.9 /100 | #48 | Exceptional 10.9% |
| Vietnamese | 99.9 /100 | #49 | Exceptional 10.9% |
| Immigrants | Saudi Arabia | 99.9 /100 | #50 | Exceptional 10.9% |
| Peruvians | 99.8 /100 | #51 | Exceptional 10.9% |
| South Americans | 99.8 /100 | #52 | Exceptional 10.9% |
| Immigrants | Spain | 99.8 /100 | #53 | Exceptional 10.9% |
| Jordanians | 99.8 /100 | #54 | Exceptional 10.9% |
| Immigrants | El Salvador | 99.8 /100 | #55 | Exceptional 10.9% |
| Immigrants | Lithuania | 99.8 /100 | #56 | Exceptional 10.9% |
Demographics Similar to Immigrants from Belize by Disability
In terms of disability, the demographic groups most similar to Immigrants from Belize are Serbian (11.9%, a difference of 0.010%), Barbadian (11.9%, a difference of 0.050%), Ukrainian (11.9%, a difference of 0.050%), Immigrants from Panama (11.9%, a difference of 0.050%), and Somali (11.9%, a difference of 0.17%).
| Demographics | Rating | Rank | Disability |
| Immigrants | West Indies | 21.1 /100 | #190 | Fair 11.9% |
| Ute | 19.5 /100 | #191 | Poor 11.9% |
| Lithuanians | 18.8 /100 | #192 | Poor 11.9% |
| Immigrants | Bosnia and Herzegovina | 18.0 /100 | #193 | Poor 11.9% |
| Somalis | 17.3 /100 | #194 | Poor 11.9% |
| Barbadians | 15.8 /100 | #195 | Poor 11.9% |
| Serbians | 15.4 /100 | #196 | Poor 11.9% |
| Immigrants | Belize | 15.2 /100 | #197 | Poor 11.9% |
| Ukrainians | 14.7 /100 | #198 | Poor 11.9% |
| Immigrants | Panama | 14.6 /100 | #199 | Poor 11.9% |
| Belizeans | 12.8 /100 | #200 | Poor 11.9% |
| Assyrians/Chaldeans/Syriacs | 12.6 /100 | #201 | Poor 11.9% |
| Immigrants | England | 12.0 /100 | #202 | Poor 12.0% |
| British West Indians | 11.5 /100 | #203 | Poor 12.0% |
| Mexican American Indians | 11.4 /100 | #204 | Poor 12.0% |