Vietnamese vs Haitian Disability
COMPARE
Vietnamese
Haitian
Disability
Disability Comparison
Vietnamese
Haitians
10.9%
DISABILITY
99.9/ 100
METRIC RATING
49th/ 347
METRIC RANK
11.7%
DISABILITY
48.6/ 100
METRIC RATING
175th/ 347
METRIC RANK
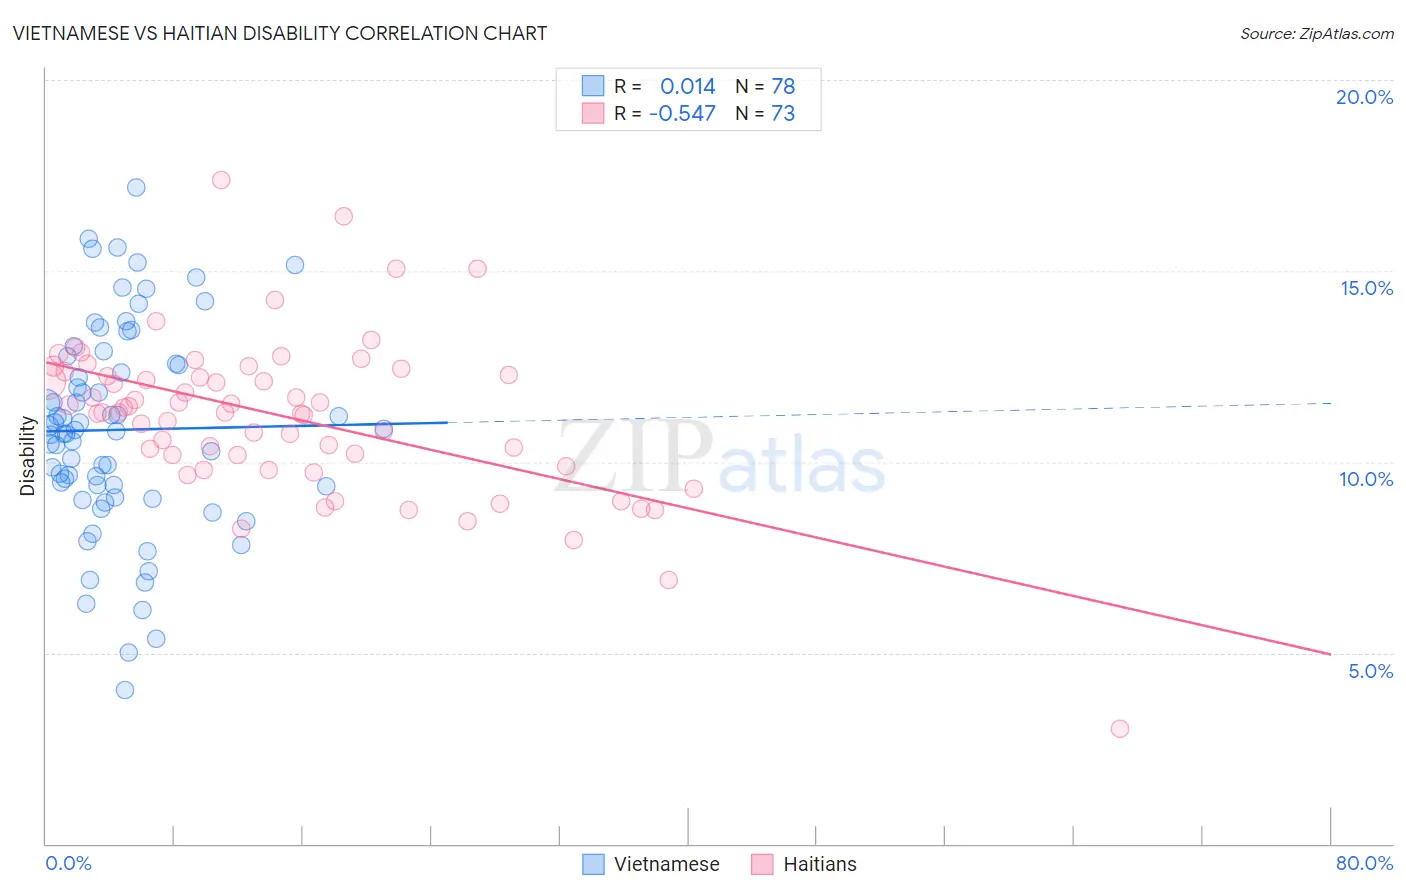
Vietnamese vs Haitian Disability Correlation Chart
The statistical analysis conducted on geographies consisting of 170,758,607 people shows no correlation between the proportion of Vietnamese and percentage of population with a disability in the United States with a correlation coefficient (R) of 0.014 and weighted average of 10.9%. Similarly, the statistical analysis conducted on geographies consisting of 287,941,476 people shows a substantial negative correlation between the proportion of Haitians and percentage of population with a disability in the United States with a correlation coefficient (R) of -0.547 and weighted average of 11.7%, a difference of 7.8%.
Disability Correlation Summary
| Measurement | Vietnamese | Haitian |
| Minimum | 4.0% | 3.0% |
| Maximum | 17.2% | 17.4% |
| Range | 13.2% | 14.4% |
| Mean | 10.8% | 11.2% |
| Median | 10.8% | 11.3% |
| Interquartile 25% (IQ1) | 9.4% | 10.0% |
| Interquartile 75% (IQ3) | 12.6% | 12.3% |
| Interquartile Range (IQR) | 3.2% | 2.3% |
| Standard Deviation (Sample) | 2.7% | 2.1% |
| Standard Deviation (Population) | 2.7% | 2.1% |
Similar Demographics by Disability
Demographics Similar to Vietnamese by Disability
In terms of disability, the demographic groups most similar to Vietnamese are Immigrants from Saudi Arabia (10.9%, a difference of 0.0%), Peruvian (10.9%, a difference of 0.010%), Soviet Union (10.9%, a difference of 0.060%), South American (10.9%, a difference of 0.070%), and Immigrants from Spain (10.9%, a difference of 0.090%).
| Demographics | Rating | Rank | Disability |
| Immigrants | Nepal | 99.9 /100 | #42 | Exceptional 10.8% |
| Israelis | 99.9 /100 | #43 | Exceptional 10.8% |
| Immigrants | Japan | 99.9 /100 | #44 | Exceptional 10.8% |
| Immigrants | Peru | 99.9 /100 | #45 | Exceptional 10.8% |
| Tongans | 99.9 /100 | #46 | Exceptional 10.8% |
| Taiwanese | 99.9 /100 | #47 | Exceptional 10.8% |
| Soviet Union | 99.9 /100 | #48 | Exceptional 10.9% |
| Vietnamese | 99.9 /100 | #49 | Exceptional 10.9% |
| Immigrants | Saudi Arabia | 99.9 /100 | #50 | Exceptional 10.9% |
| Peruvians | 99.8 /100 | #51 | Exceptional 10.9% |
| South Americans | 99.8 /100 | #52 | Exceptional 10.9% |
| Immigrants | Spain | 99.8 /100 | #53 | Exceptional 10.9% |
| Jordanians | 99.8 /100 | #54 | Exceptional 10.9% |
| Immigrants | El Salvador | 99.8 /100 | #55 | Exceptional 10.9% |
| Immigrants | Lithuania | 99.8 /100 | #56 | Exceptional 10.9% |
Demographics Similar to Haitians by Disability
In terms of disability, the demographic groups most similar to Haitians are Immigrants from Western Africa (11.7%, a difference of 0.050%), Albanian (11.7%, a difference of 0.060%), Maltese (11.7%, a difference of 0.090%), Immigrants from Central America (11.7%, a difference of 0.090%), and Greek (11.7%, a difference of 0.11%).
| Demographics | Rating | Rank | Disability |
| Immigrants | Latin America | 54.1 /100 | #168 | Average 11.7% |
| Immigrants | Austria | 53.4 /100 | #169 | Average 11.7% |
| Immigrants | Albania | 52.8 /100 | #170 | Average 11.7% |
| Immigrants | Southern Europe | 52.8 /100 | #171 | Average 11.7% |
| Trinidadians and Tobagonians | 52.7 /100 | #172 | Average 11.7% |
| Maltese | 50.6 /100 | #173 | Average 11.7% |
| Albanians | 50.0 /100 | #174 | Average 11.7% |
| Haitians | 48.6 /100 | #175 | Average 11.7% |
| Immigrants | Western Africa | 47.5 /100 | #176 | Average 11.7% |
| Immigrants | Central America | 46.6 /100 | #177 | Average 11.7% |
| Greeks | 46.2 /100 | #178 | Average 11.7% |
| Immigrants | Armenia | 41.9 /100 | #179 | Average 11.7% |
| Immigrants | Honduras | 37.8 /100 | #180 | Fair 11.8% |
| Immigrants | Oceania | 34.3 /100 | #181 | Fair 11.8% |
| Icelanders | 34.0 /100 | #182 | Fair 11.8% |