Venezuelan vs Immigrants from Congo Disability Age Under 5
COMPARE
Venezuelan
Immigrants from Congo
Disability Age Under 5
Disability Age Under 5 Comparison
Venezuelans
Immigrants from Congo
1.2%
DISABILITY AGE UNDER 5
47.1/ 100
METRIC RATING
178th/ 347
METRIC RANK
1.1%
DISABILITY AGE UNDER 5
99.8/ 100
METRIC RATING
46th/ 347
METRIC RANK
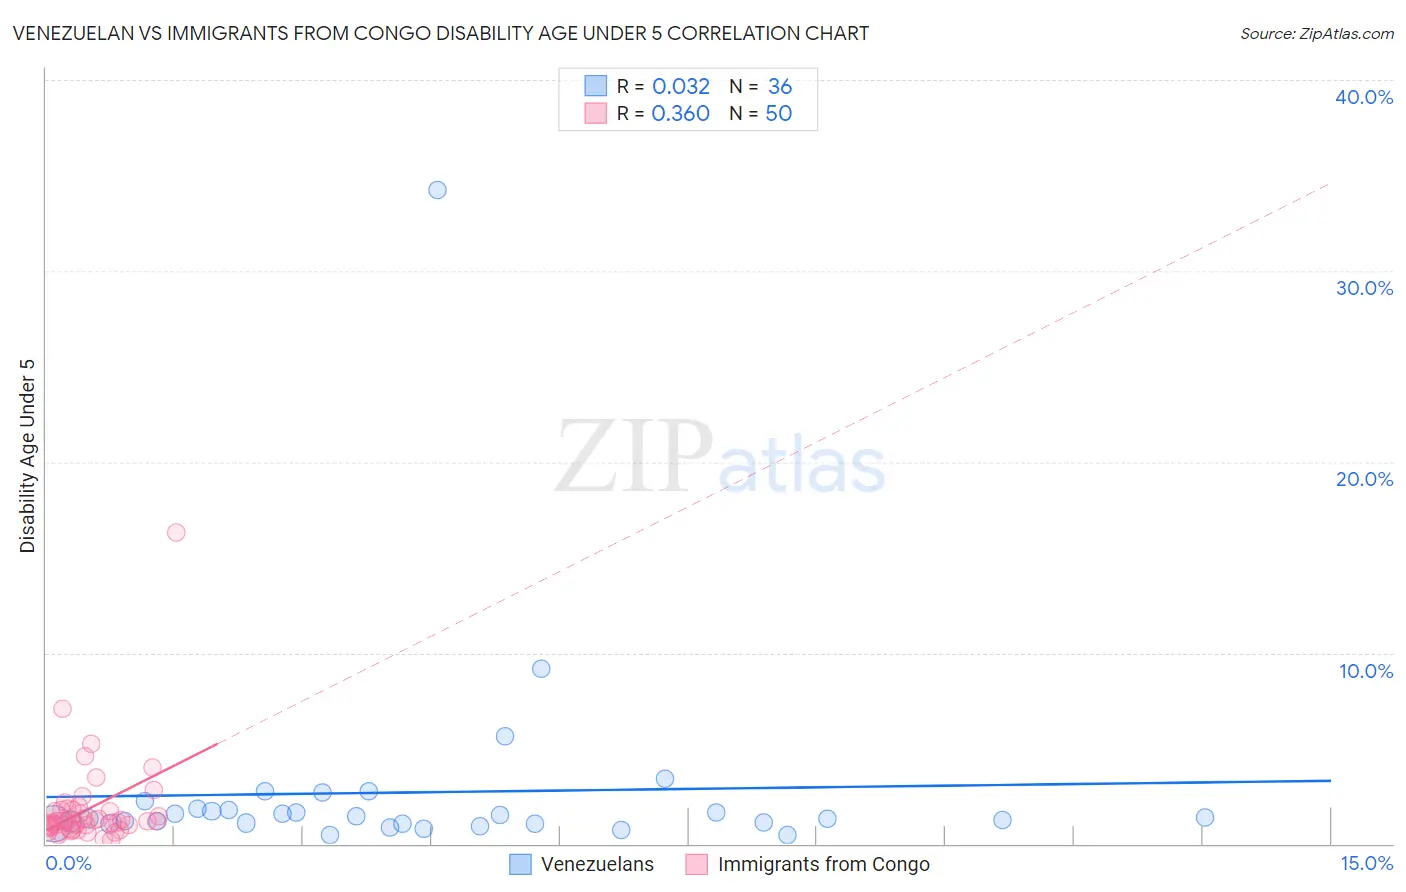
Venezuelan vs Immigrants from Congo Disability Age Under 5 Correlation Chart
The statistical analysis conducted on geographies consisting of 181,706,863 people shows no correlation between the proportion of Venezuelans and percentage of population with a disability under the age of 5 in the United States with a correlation coefficient (R) of 0.032 and weighted average of 1.2%. Similarly, the statistical analysis conducted on geographies consisting of 74,886,449 people shows a mild positive correlation between the proportion of Immigrants from Congo and percentage of population with a disability under the age of 5 in the United States with a correlation coefficient (R) of 0.360 and weighted average of 1.1%, a difference of 16.3%.
Disability Age Under 5 Correlation Summary
| Measurement | Venezuelan | Immigrants from Congo |
| Minimum | 0.44% | 0.19% |
| Maximum | 34.2% | 16.3% |
| Range | 33.8% | 16.1% |
| Mean | 2.7% | 1.8% |
| Median | 1.4% | 1.2% |
| Interquartile 25% (IQ1) | 1.0% | 0.89% |
| Interquartile 75% (IQ3) | 1.8% | 1.8% |
| Interquartile Range (IQR) | 0.76% | 0.87% |
| Standard Deviation (Sample) | 5.6% | 2.5% |
| Standard Deviation (Population) | 5.6% | 2.4% |
Similar Demographics by Disability Age Under 5
Demographics Similar to Venezuelans by Disability Age Under 5
In terms of disability age under 5, the demographic groups most similar to Venezuelans are Comanche (1.2%, a difference of 0.040%), Immigrants from Kenya (1.2%, a difference of 0.14%), Immigrants from Bahamas (1.2%, a difference of 0.17%), Immigrants from Mexico (1.2%, a difference of 0.24%), and Immigrants from Latvia (1.2%, a difference of 0.27%).
| Demographics | Rating | Rank | Disability Age Under 5 |
| Guamanians/Chamorros | 57.8 /100 | #171 | Average 1.2% |
| Crow | 51.0 /100 | #172 | Average 1.2% |
| Immigrants | Ireland | 50.3 /100 | #173 | Average 1.2% |
| Immigrants | Latvia | 50.0 /100 | #174 | Average 1.2% |
| Immigrants | Nigeria | 50.0 /100 | #175 | Average 1.2% |
| Immigrants | Kenya | 48.6 /100 | #176 | Average 1.2% |
| Comanche | 47.5 /100 | #177 | Average 1.2% |
| Venezuelans | 47.1 /100 | #178 | Average 1.2% |
| Immigrants | Bahamas | 45.2 /100 | #179 | Average 1.2% |
| Immigrants | Mexico | 44.4 /100 | #180 | Average 1.2% |
| Immigrants | Peru | 43.7 /100 | #181 | Average 1.2% |
| Macedonians | 43.7 /100 | #181 | Average 1.2% |
| Immigrants | Saudi Arabia | 43.3 /100 | #183 | Average 1.2% |
| Palestinians | 43.0 /100 | #184 | Average 1.2% |
| Immigrants | Western Africa | 42.5 /100 | #185 | Average 1.2% |
Demographics Similar to Immigrants from Congo by Disability Age Under 5
In terms of disability age under 5, the demographic groups most similar to Immigrants from Congo are Immigrants from Sweden (1.1%, a difference of 0.14%), Immigrants from Singapore (1.1%, a difference of 0.36%), Immigrants from Turkey (1.1%, a difference of 0.40%), Immigrants from Russia (1.1%, a difference of 0.57%), and Immigrants from Japan (1.1%, a difference of 0.58%).
| Demographics | Rating | Rank | Disability Age Under 5 |
| Filipinos | 99.9 /100 | #39 | Exceptional 1.1% |
| Immigrants | Albania | 99.9 /100 | #40 | Exceptional 1.1% |
| Thais | 99.8 /100 | #41 | Exceptional 1.1% |
| Immigrants | Bulgaria | 99.8 /100 | #42 | Exceptional 1.1% |
| Pima | 99.8 /100 | #43 | Exceptional 1.1% |
| Immigrants | Asia | 99.8 /100 | #44 | Exceptional 1.1% |
| Immigrants | Turkey | 99.8 /100 | #45 | Exceptional 1.1% |
| Immigrants | Congo | 99.8 /100 | #46 | Exceptional 1.1% |
| Immigrants | Sweden | 99.8 /100 | #47 | Exceptional 1.1% |
| Immigrants | Singapore | 99.7 /100 | #48 | Exceptional 1.1% |
| Immigrants | Russia | 99.7 /100 | #49 | Exceptional 1.1% |
| Immigrants | Japan | 99.7 /100 | #50 | Exceptional 1.1% |
| Immigrants | Kazakhstan | 99.7 /100 | #51 | Exceptional 1.1% |
| Immigrants | Bolivia | 99.6 /100 | #52 | Exceptional 1.1% |
| Asians | 99.6 /100 | #53 | Exceptional 1.1% |