Immigrants from South Eastern Asia vs Immigrants from Congo Disability Age Under 5
COMPARE
Immigrants from South Eastern Asia
Immigrants from Congo
Disability Age Under 5
Disability Age Under 5 Comparison
Immigrants from South Eastern Asia
Immigrants from Congo
1.1%
DISABILITY AGE UNDER 5
96.5/ 100
METRIC RATING
98th/ 347
METRIC RANK
1.1%
DISABILITY AGE UNDER 5
99.8/ 100
METRIC RATING
46th/ 347
METRIC RANK
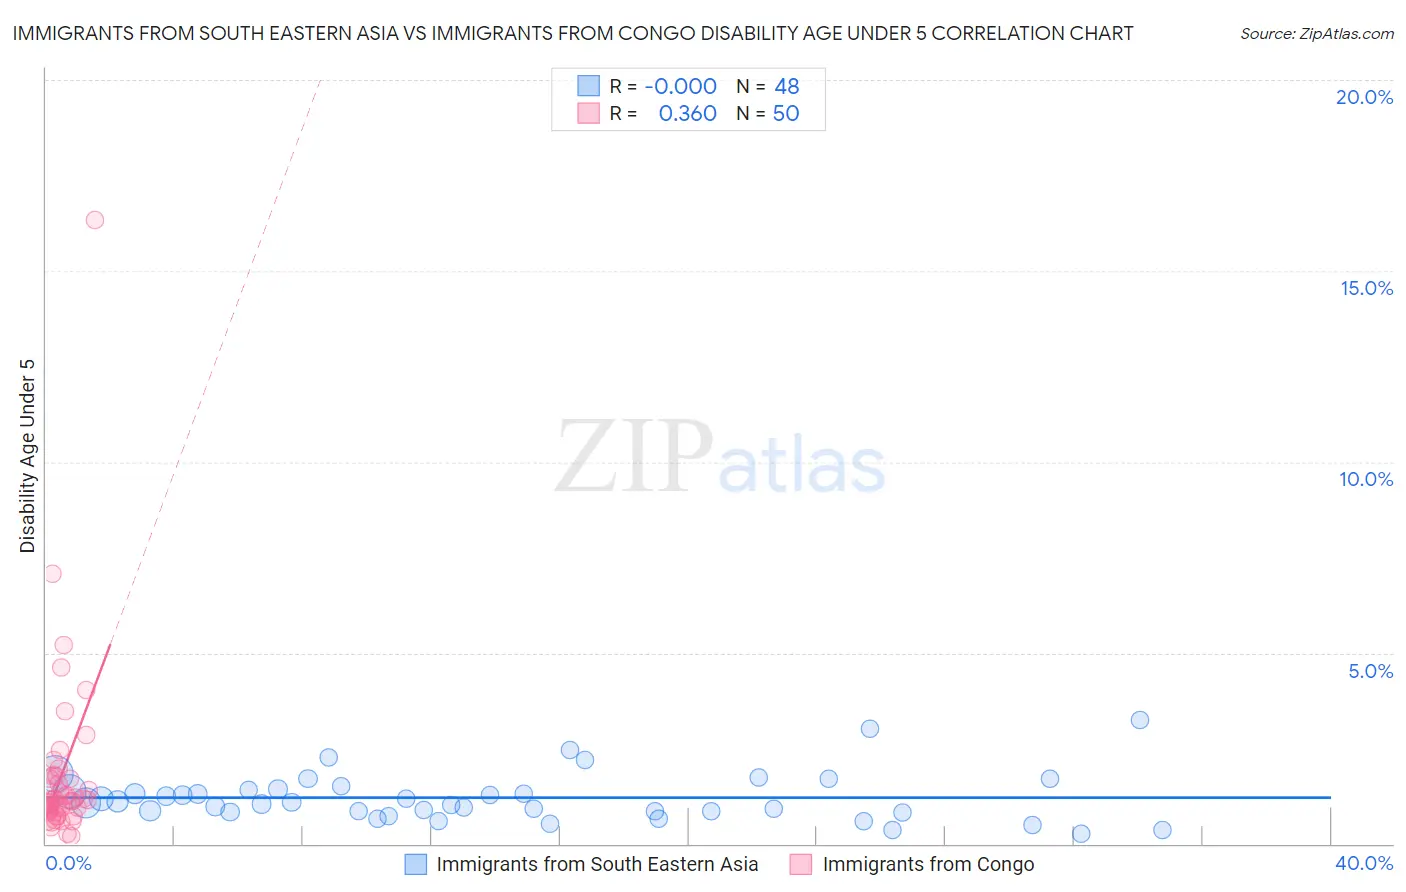
Immigrants from South Eastern Asia vs Immigrants from Congo Disability Age Under 5 Correlation Chart
The statistical analysis conducted on geographies consisting of 251,042,035 people shows no correlation between the proportion of Immigrants from South Eastern Asia and percentage of population with a disability under the age of 5 in the United States with a correlation coefficient (R) of -0.000 and weighted average of 1.1%. Similarly, the statistical analysis conducted on geographies consisting of 74,886,449 people shows a mild positive correlation between the proportion of Immigrants from Congo and percentage of population with a disability under the age of 5 in the United States with a correlation coefficient (R) of 0.360 and weighted average of 1.1%, a difference of 7.3%.
Disability Age Under 5 Correlation Summary
| Measurement | Immigrants from South Eastern Asia | Immigrants from Congo |
| Minimum | 0.25% | 0.19% |
| Maximum | 3.2% | 16.3% |
| Range | 3.0% | 16.1% |
| Mean | 1.2% | 1.8% |
| Median | 1.1% | 1.2% |
| Interquartile 25% (IQ1) | 0.84% | 0.89% |
| Interquartile 75% (IQ3) | 1.4% | 1.8% |
| Interquartile Range (IQR) | 0.59% | 0.87% |
| Standard Deviation (Sample) | 0.63% | 2.5% |
| Standard Deviation (Population) | 0.63% | 2.4% |
Similar Demographics by Disability Age Under 5
Demographics Similar to Immigrants from South Eastern Asia by Disability Age Under 5
In terms of disability age under 5, the demographic groups most similar to Immigrants from South Eastern Asia are Immigrants from Iraq (1.1%, a difference of 0.010%), Mongolian (1.1%, a difference of 0.11%), Dominican (1.1%, a difference of 0.13%), Nicaraguan (1.1%, a difference of 0.15%), and Immigrants from Moldova (1.1%, a difference of 0.22%).
| Demographics | Rating | Rank | Disability Age Under 5 |
| Albanians | 97.2 /100 | #91 | Exceptional 1.1% |
| Immigrants | Cuba | 97.0 /100 | #92 | Exceptional 1.1% |
| Spanish Americans | 96.9 /100 | #93 | Exceptional 1.1% |
| Sri Lankans | 96.8 /100 | #94 | Exceptional 1.1% |
| Immigrants | Moldova | 96.8 /100 | #95 | Exceptional 1.1% |
| Mongolians | 96.6 /100 | #96 | Exceptional 1.1% |
| Immigrants | Iraq | 96.5 /100 | #97 | Exceptional 1.1% |
| Immigrants | South Eastern Asia | 96.5 /100 | #98 | Exceptional 1.1% |
| Dominicans | 96.3 /100 | #99 | Exceptional 1.1% |
| Nicaraguans | 96.3 /100 | #100 | Exceptional 1.1% |
| Immigrants | Uganda | 96.1 /100 | #101 | Exceptional 1.1% |
| Immigrants | Morocco | 96.0 /100 | #102 | Exceptional 1.2% |
| Immigrants | Nicaragua | 96.0 /100 | #103 | Exceptional 1.2% |
| Indonesians | 95.9 /100 | #104 | Exceptional 1.2% |
| Immigrants | South Africa | 95.6 /100 | #105 | Exceptional 1.2% |
Demographics Similar to Immigrants from Congo by Disability Age Under 5
In terms of disability age under 5, the demographic groups most similar to Immigrants from Congo are Immigrants from Sweden (1.1%, a difference of 0.14%), Immigrants from Singapore (1.1%, a difference of 0.36%), Immigrants from Turkey (1.1%, a difference of 0.40%), Immigrants from Russia (1.1%, a difference of 0.57%), and Immigrants from Japan (1.1%, a difference of 0.58%).
| Demographics | Rating | Rank | Disability Age Under 5 |
| Filipinos | 99.9 /100 | #39 | Exceptional 1.1% |
| Immigrants | Albania | 99.9 /100 | #40 | Exceptional 1.1% |
| Thais | 99.8 /100 | #41 | Exceptional 1.1% |
| Immigrants | Bulgaria | 99.8 /100 | #42 | Exceptional 1.1% |
| Pima | 99.8 /100 | #43 | Exceptional 1.1% |
| Immigrants | Asia | 99.8 /100 | #44 | Exceptional 1.1% |
| Immigrants | Turkey | 99.8 /100 | #45 | Exceptional 1.1% |
| Immigrants | Congo | 99.8 /100 | #46 | Exceptional 1.1% |
| Immigrants | Sweden | 99.8 /100 | #47 | Exceptional 1.1% |
| Immigrants | Singapore | 99.7 /100 | #48 | Exceptional 1.1% |
| Immigrants | Russia | 99.7 /100 | #49 | Exceptional 1.1% |
| Immigrants | Japan | 99.7 /100 | #50 | Exceptional 1.1% |
| Immigrants | Kazakhstan | 99.7 /100 | #51 | Exceptional 1.1% |
| Immigrants | Bolivia | 99.6 /100 | #52 | Exceptional 1.1% |
| Asians | 99.6 /100 | #53 | Exceptional 1.1% |