Venezuelan vs Immigrants from Congo Ambulatory Disability
COMPARE
Venezuelan
Immigrants from Congo
Ambulatory Disability
Ambulatory Disability Comparison
Venezuelans
Immigrants from Congo
5.5%
AMBULATORY DISABILITY
99.9/ 100
METRIC RATING
40th/ 347
METRIC RANK
6.2%
AMBULATORY DISABILITY
18.2/ 100
METRIC RATING
204th/ 347
METRIC RANK
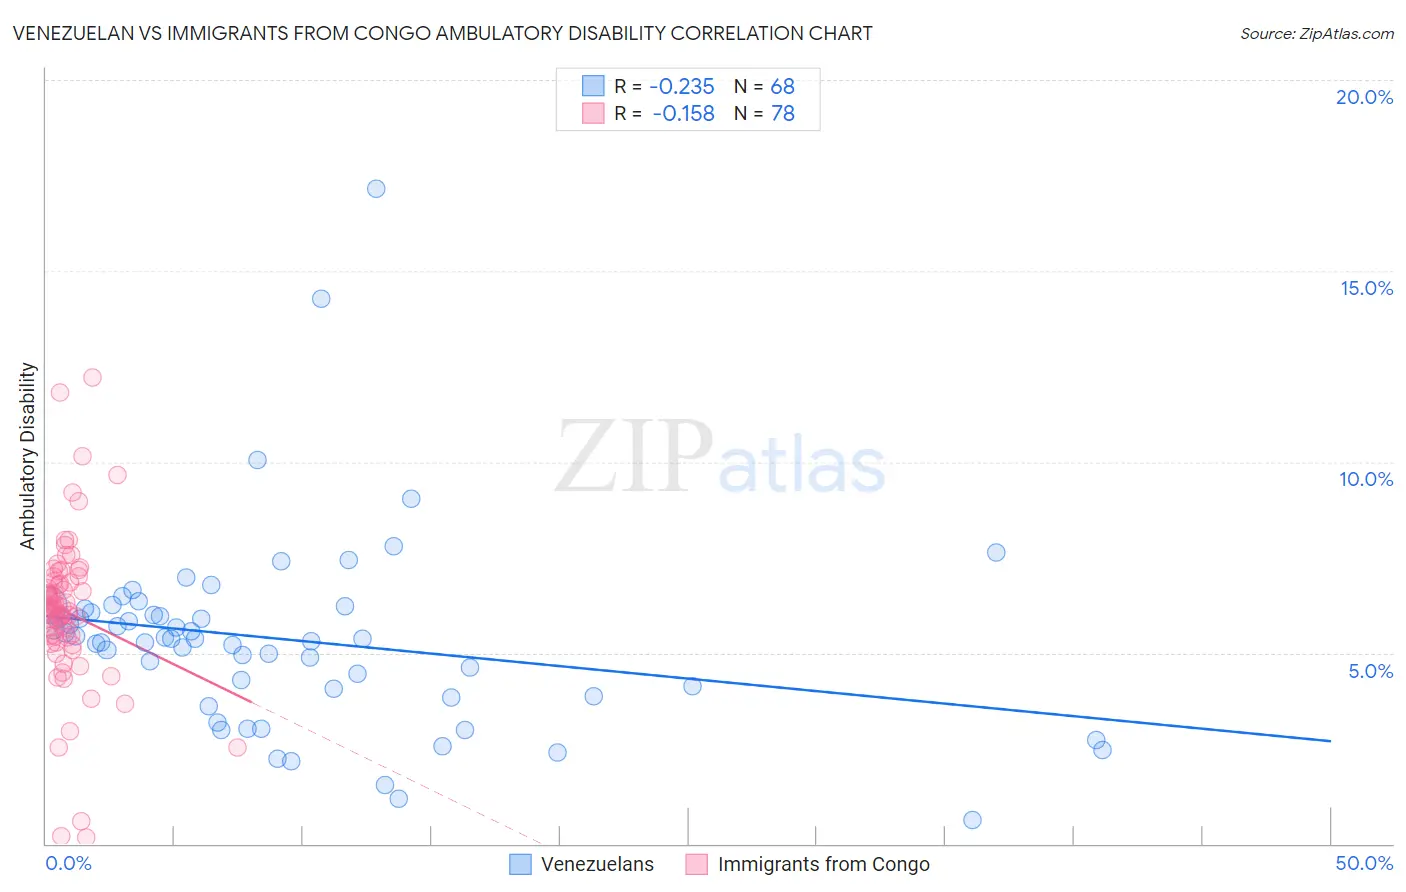
Venezuelan vs Immigrants from Congo Ambulatory Disability Correlation Chart
The statistical analysis conducted on geographies consisting of 306,237,534 people shows a weak negative correlation between the proportion of Venezuelans and percentage of population with ambulatory disability in the United States with a correlation coefficient (R) of -0.235 and weighted average of 5.5%. Similarly, the statistical analysis conducted on geographies consisting of 92,115,389 people shows a poor negative correlation between the proportion of Immigrants from Congo and percentage of population with ambulatory disability in the United States with a correlation coefficient (R) of -0.158 and weighted average of 6.2%, a difference of 13.4%.
Ambulatory Disability Correlation Summary
| Measurement | Venezuelan | Immigrants from Congo |
| Minimum | 0.63% | 0.17% |
| Maximum | 17.1% | 12.2% |
| Range | 16.5% | 12.0% |
| Mean | 5.3% | 6.1% |
| Median | 5.4% | 6.1% |
| Interquartile 25% (IQ1) | 4.0% | 5.4% |
| Interquartile 75% (IQ3) | 6.1% | 6.9% |
| Interquartile Range (IQR) | 2.1% | 1.5% |
| Standard Deviation (Sample) | 2.6% | 2.0% |
| Standard Deviation (Population) | 2.5% | 2.0% |
Similar Demographics by Ambulatory Disability
Demographics Similar to Venezuelans by Ambulatory Disability
In terms of ambulatory disability, the demographic groups most similar to Venezuelans are Mongolian (5.5%, a difference of 0.080%), Argentinean (5.5%, a difference of 0.16%), Immigrants from Eritrea (5.5%, a difference of 0.34%), Turkish (5.5%, a difference of 0.43%), and Cypriot (5.5%, a difference of 0.43%).
| Demographics | Rating | Rank | Ambulatory Disability |
| Immigrants | Pakistan | 100.0 /100 | #33 | Exceptional 5.5% |
| Immigrants | Asia | 100.0 /100 | #34 | Exceptional 5.5% |
| Afghans | 100.0 /100 | #35 | Exceptional 5.5% |
| Immigrants | Malaysia | 100.0 /100 | #36 | Exceptional 5.5% |
| Turks | 100.0 /100 | #37 | Exceptional 5.5% |
| Cypriots | 100.0 /100 | #38 | Exceptional 5.5% |
| Immigrants | Eritrea | 100.0 /100 | #39 | Exceptional 5.5% |
| Venezuelans | 99.9 /100 | #40 | Exceptional 5.5% |
| Mongolians | 99.9 /100 | #41 | Exceptional 5.5% |
| Argentineans | 99.9 /100 | #42 | Exceptional 5.5% |
| Paraguayans | 99.9 /100 | #43 | Exceptional 5.5% |
| Immigrants | Indonesia | 99.9 /100 | #44 | Exceptional 5.5% |
| Immigrants | Sweden | 99.9 /100 | #45 | Exceptional 5.6% |
| Egyptians | 99.9 /100 | #46 | Exceptional 5.6% |
| Immigrants | Japan | 99.9 /100 | #47 | Exceptional 5.6% |
Demographics Similar to Immigrants from Congo by Ambulatory Disability
In terms of ambulatory disability, the demographic groups most similar to Immigrants from Congo are Immigrants from Ukraine (6.2%, a difference of 0.010%), Slovene (6.2%, a difference of 0.020%), Finnish (6.2%, a difference of 0.090%), Albanian (6.2%, a difference of 0.13%), and Immigrants from Central America (6.2%, a difference of 0.15%).
| Demographics | Rating | Rank | Ambulatory Disability |
| Poles | 26.3 /100 | #197 | Fair 6.2% |
| Immigrants | Bangladesh | 24.6 /100 | #198 | Fair 6.2% |
| Italians | 22.6 /100 | #199 | Fair 6.2% |
| Immigrants | Cambodia | 21.5 /100 | #200 | Fair 6.2% |
| Immigrants | Central America | 20.1 /100 | #201 | Fair 6.2% |
| Albanians | 19.7 /100 | #202 | Poor 6.2% |
| Immigrants | Ukraine | 18.4 /100 | #203 | Poor 6.2% |
| Immigrants | Congo | 18.2 /100 | #204 | Poor 6.2% |
| Slovenes | 18.0 /100 | #205 | Poor 6.2% |
| Finns | 17.2 /100 | #206 | Poor 6.2% |
| Alsatians | 15.1 /100 | #207 | Poor 6.3% |
| Bangladeshis | 14.2 /100 | #208 | Poor 6.3% |
| Immigrants | Iraq | 14.0 /100 | #209 | Poor 6.3% |
| Immigrants | Laos | 13.2 /100 | #210 | Poor 6.3% |
| Samoans | 12.1 /100 | #211 | Poor 6.3% |