Venezuelan vs Immigrants from Czechoslovakia Disability Age Under 5
COMPARE
Venezuelan
Immigrants from Czechoslovakia
Disability Age Under 5
Disability Age Under 5 Comparison
Venezuelans
Immigrants from Czechoslovakia
1.2%
DISABILITY AGE UNDER 5
47.1/ 100
METRIC RATING
178th/ 347
METRIC RANK
1.2%
DISABILITY AGE UNDER 5
82.8/ 100
METRIC RATING
138th/ 347
METRIC RANK
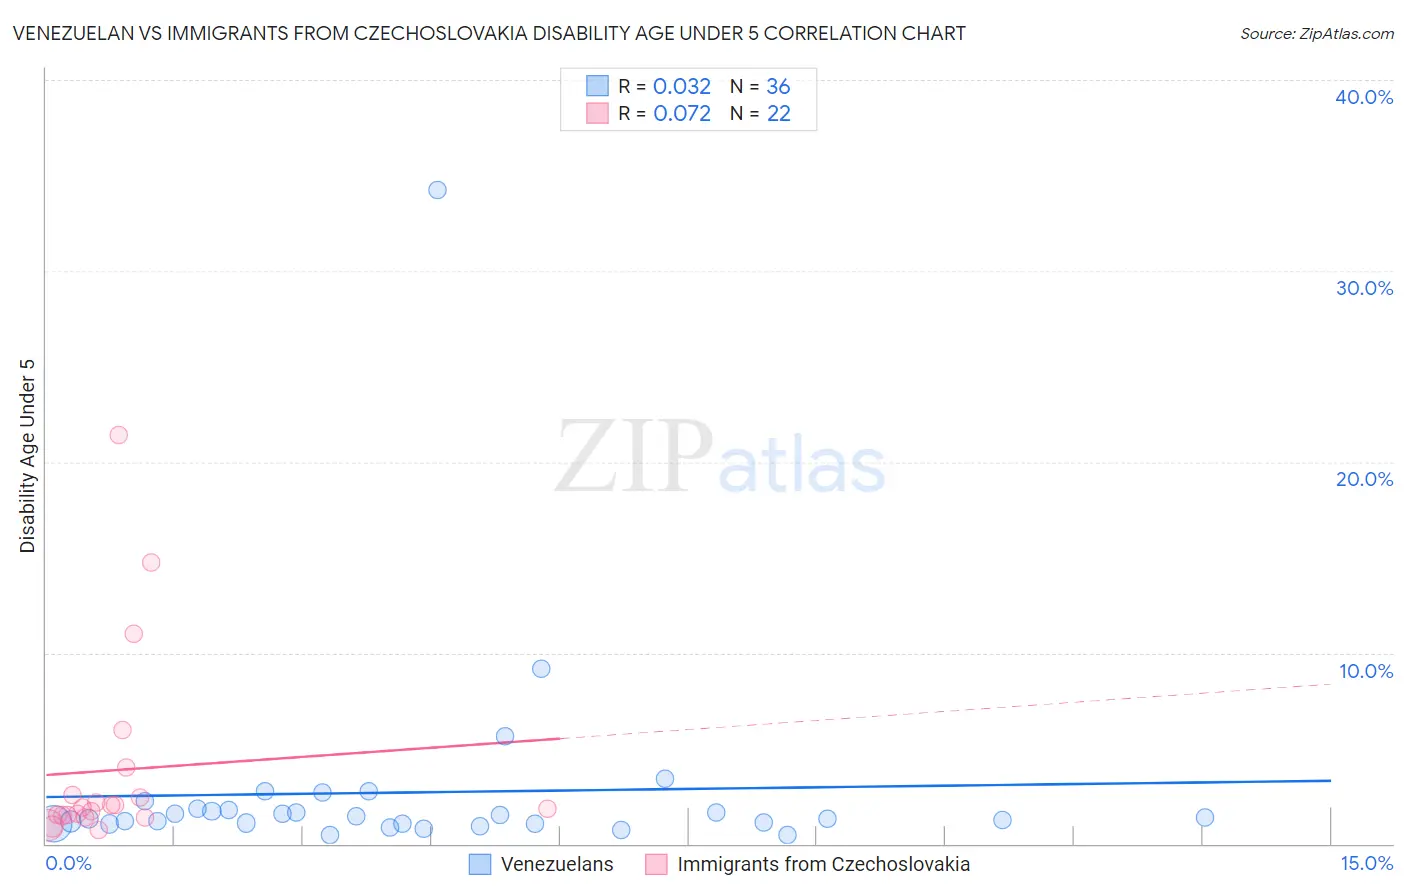
Venezuelan vs Immigrants from Czechoslovakia Disability Age Under 5 Correlation Chart
The statistical analysis conducted on geographies consisting of 181,706,863 people shows no correlation between the proportion of Venezuelans and percentage of population with a disability under the age of 5 in the United States with a correlation coefficient (R) of 0.032 and weighted average of 1.2%. Similarly, the statistical analysis conducted on geographies consisting of 125,406,021 people shows a slight positive correlation between the proportion of Immigrants from Czechoslovakia and percentage of population with a disability under the age of 5 in the United States with a correlation coefficient (R) of 0.072 and weighted average of 1.2%, a difference of 4.0%.
Disability Age Under 5 Correlation Summary
| Measurement | Venezuelan | Immigrants from Czechoslovakia |
| Minimum | 0.44% | 0.72% |
| Maximum | 34.2% | 21.4% |
| Range | 33.8% | 20.7% |
| Mean | 2.7% | 3.9% |
| Median | 1.4% | 1.8% |
| Interquartile 25% (IQ1) | 1.0% | 1.5% |
| Interquartile 75% (IQ3) | 1.8% | 2.6% |
| Interquartile Range (IQR) | 0.76% | 1.1% |
| Standard Deviation (Sample) | 5.6% | 5.2% |
| Standard Deviation (Population) | 5.6% | 5.1% |
Similar Demographics by Disability Age Under 5
Demographics Similar to Venezuelans by Disability Age Under 5
In terms of disability age under 5, the demographic groups most similar to Venezuelans are Comanche (1.2%, a difference of 0.040%), Immigrants from Kenya (1.2%, a difference of 0.14%), Immigrants from Bahamas (1.2%, a difference of 0.17%), Immigrants from Mexico (1.2%, a difference of 0.24%), and Immigrants from Latvia (1.2%, a difference of 0.27%).
| Demographics | Rating | Rank | Disability Age Under 5 |
| Guamanians/Chamorros | 57.8 /100 | #171 | Average 1.2% |
| Crow | 51.0 /100 | #172 | Average 1.2% |
| Immigrants | Ireland | 50.3 /100 | #173 | Average 1.2% |
| Immigrants | Latvia | 50.0 /100 | #174 | Average 1.2% |
| Immigrants | Nigeria | 50.0 /100 | #175 | Average 1.2% |
| Immigrants | Kenya | 48.6 /100 | #176 | Average 1.2% |
| Comanche | 47.5 /100 | #177 | Average 1.2% |
| Venezuelans | 47.1 /100 | #178 | Average 1.2% |
| Immigrants | Bahamas | 45.2 /100 | #179 | Average 1.2% |
| Immigrants | Mexico | 44.4 /100 | #180 | Average 1.2% |
| Immigrants | Peru | 43.7 /100 | #181 | Average 1.2% |
| Macedonians | 43.7 /100 | #181 | Average 1.2% |
| Immigrants | Saudi Arabia | 43.3 /100 | #183 | Average 1.2% |
| Palestinians | 43.0 /100 | #184 | Average 1.2% |
| Immigrants | Western Africa | 42.5 /100 | #185 | Average 1.2% |
Demographics Similar to Immigrants from Czechoslovakia by Disability Age Under 5
In terms of disability age under 5, the demographic groups most similar to Immigrants from Czechoslovakia are Immigrants from Eastern Africa (1.2%, a difference of 0.050%), Moroccan (1.2%, a difference of 0.14%), New Zealander (1.2%, a difference of 0.23%), Fijian (1.2%, a difference of 0.32%), and Somali (1.2%, a difference of 0.32%).
| Demographics | Rating | Rank | Disability Age Under 5 |
| Immigrants | Serbia | 87.6 /100 | #131 | Excellent 1.2% |
| Immigrants | Eastern Europe | 87.3 /100 | #132 | Excellent 1.2% |
| Immigrants | Spain | 86.5 /100 | #133 | Excellent 1.2% |
| Argentineans | 85.7 /100 | #134 | Excellent 1.2% |
| Fijians | 84.7 /100 | #135 | Excellent 1.2% |
| Moroccans | 83.6 /100 | #136 | Excellent 1.2% |
| Immigrants | Eastern Africa | 83.1 /100 | #137 | Excellent 1.2% |
| Immigrants | Czechoslovakia | 82.8 /100 | #138 | Excellent 1.2% |
| New Zealanders | 81.4 /100 | #139 | Excellent 1.2% |
| Somalis | 80.8 /100 | #140 | Excellent 1.2% |
| Immigrants | Honduras | 80.4 /100 | #141 | Excellent 1.2% |
| Immigrants | Colombia | 79.3 /100 | #142 | Good 1.2% |
| Alsatians | 79.3 /100 | #143 | Good 1.2% |
| Immigrants | Middle Africa | 79.3 /100 | #144 | Good 1.2% |
| Immigrants | Zimbabwe | 77.9 /100 | #145 | Good 1.2% |