Venezuelan vs Immigrants from Congo Cognitive Disability
COMPARE
Venezuelan
Immigrants from Congo
Cognitive Disability
Cognitive Disability Comparison
Venezuelans
Immigrants from Congo
16.6%
COGNITIVE DISABILITY
99.6/ 100
METRIC RATING
64th/ 347
METRIC RANK
19.7%
COGNITIVE DISABILITY
0.0/ 100
METRIC RATING
344th/ 347
METRIC RANK
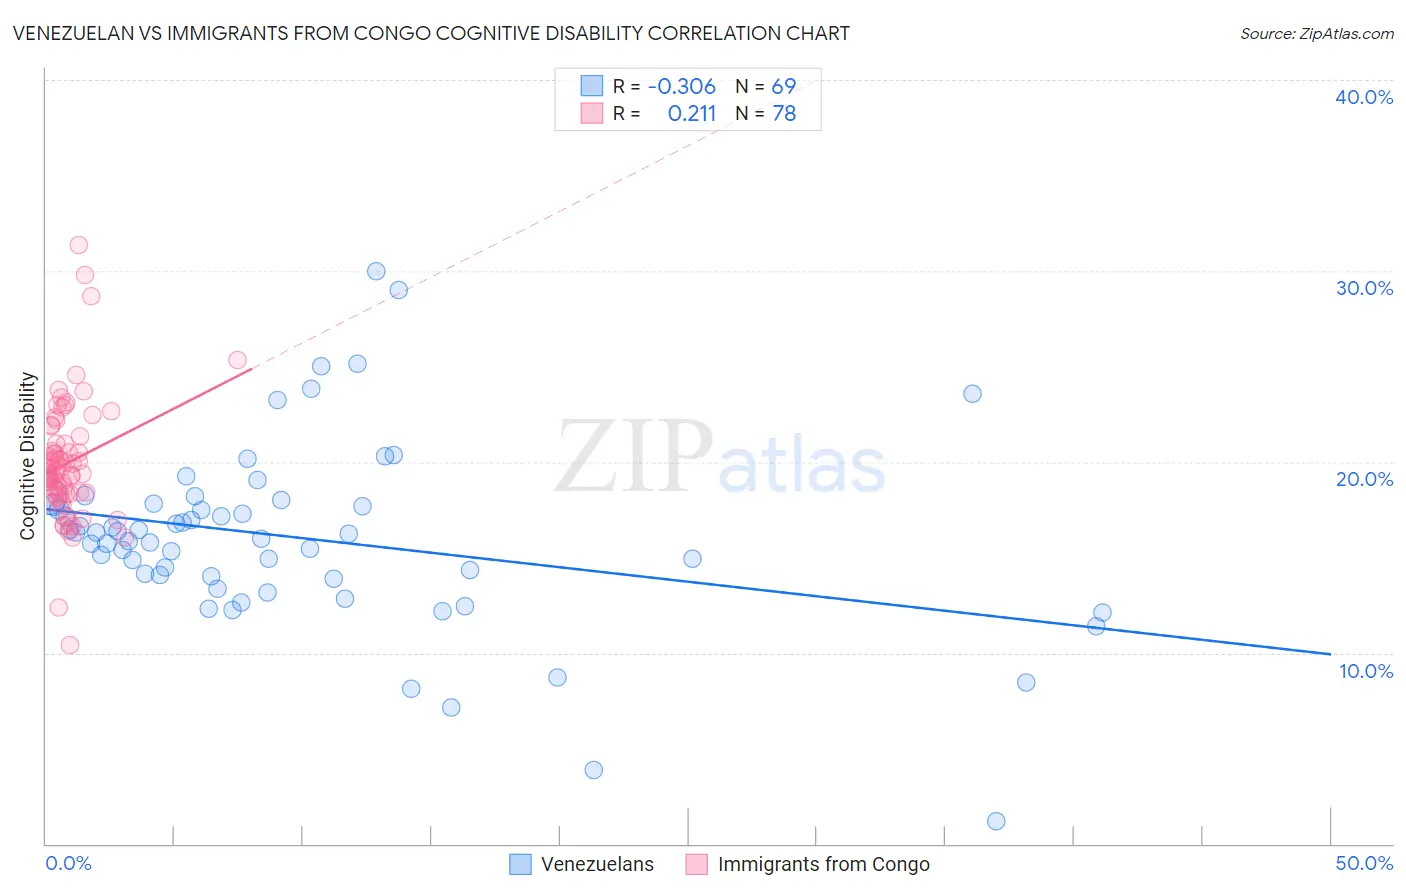
Venezuelan vs Immigrants from Congo Cognitive Disability Correlation Chart
The statistical analysis conducted on geographies consisting of 306,294,169 people shows a mild negative correlation between the proportion of Venezuelans and percentage of population with cognitive disability in the United States with a correlation coefficient (R) of -0.306 and weighted average of 16.6%. Similarly, the statistical analysis conducted on geographies consisting of 92,118,396 people shows a weak positive correlation between the proportion of Immigrants from Congo and percentage of population with cognitive disability in the United States with a correlation coefficient (R) of 0.211 and weighted average of 19.7%, a difference of 18.7%.
Cognitive Disability Correlation Summary
| Measurement | Venezuelan | Immigrants from Congo |
| Minimum | 1.2% | 10.4% |
| Maximum | 30.0% | 31.4% |
| Range | 28.8% | 21.0% |
| Mean | 16.0% | 19.9% |
| Median | 16.2% | 19.4% |
| Interquartile 25% (IQ1) | 13.9% | 18.3% |
| Interquartile 75% (IQ3) | 17.8% | 21.0% |
| Interquartile Range (IQR) | 3.8% | 2.6% |
| Standard Deviation (Sample) | 4.8% | 3.2% |
| Standard Deviation (Population) | 4.8% | 3.2% |
Similar Demographics by Cognitive Disability
Demographics Similar to Venezuelans by Cognitive Disability
In terms of cognitive disability, the demographic groups most similar to Venezuelans are Colombian (16.6%, a difference of 0.010%), Argentinean (16.6%, a difference of 0.060%), Czechoslovakian (16.6%, a difference of 0.080%), Immigrants from England (16.6%, a difference of 0.11%), and Immigrants from Ukraine (16.6%, a difference of 0.14%).
| Demographics | Rating | Rank | Cognitive Disability |
| Bhutanese | 99.7 /100 | #57 | Exceptional 16.6% |
| Pennsylvania Germans | 99.7 /100 | #58 | Exceptional 16.6% |
| Immigrants | Peru | 99.7 /100 | #59 | Exceptional 16.6% |
| Romanians | 99.7 /100 | #60 | Exceptional 16.6% |
| Immigrants | England | 99.6 /100 | #61 | Exceptional 16.6% |
| Czechoslovakians | 99.6 /100 | #62 | Exceptional 16.6% |
| Argentineans | 99.6 /100 | #63 | Exceptional 16.6% |
| Venezuelans | 99.6 /100 | #64 | Exceptional 16.6% |
| Colombians | 99.6 /100 | #65 | Exceptional 16.6% |
| Immigrants | Ukraine | 99.5 /100 | #66 | Exceptional 16.6% |
| Latvians | 99.5 /100 | #67 | Exceptional 16.6% |
| Ukrainians | 99.4 /100 | #68 | Exceptional 16.6% |
| Immigrants | Uzbekistan | 99.4 /100 | #69 | Exceptional 16.7% |
| Immigrants | Sweden | 99.4 /100 | #70 | Exceptional 16.7% |
| Immigrants | Belgium | 99.3 /100 | #71 | Exceptional 16.7% |
Demographics Similar to Immigrants from Congo by Cognitive Disability
In terms of cognitive disability, the demographic groups most similar to Immigrants from Congo are Somali (19.8%, a difference of 0.56%), Immigrants from Cabo Verde (19.9%, a difference of 0.72%), Immigrants from Somalia (20.0%, a difference of 1.5%), Immigrants from Zaire (19.4%, a difference of 1.6%), and Tohono O'odham (19.3%, a difference of 2.3%).
| Demographics | Rating | Rank | Cognitive Disability |
| Immigrants | Yemen | 0.0 /100 | #333 | Tragic 18.8% |
| Sudanese | 0.0 /100 | #334 | Tragic 18.9% |
| Senegalese | 0.0 /100 | #335 | Tragic 19.0% |
| Blacks/African Americans | 0.0 /100 | #336 | Tragic 19.0% |
| Immigrants | Saudi Arabia | 0.0 /100 | #337 | Tragic 19.1% |
| Lumbee | 0.0 /100 | #338 | Tragic 19.1% |
| Puerto Ricans | 0.0 /100 | #339 | Tragic 19.2% |
| Cape Verdeans | 0.0 /100 | #340 | Tragic 19.2% |
| Tohono O'odham | 0.0 /100 | #341 | Tragic 19.3% |
| Houma | 0.0 /100 | #342 | Tragic 19.3% |
| Immigrants | Zaire | 0.0 /100 | #343 | Tragic 19.4% |
| Immigrants | Congo | 0.0 /100 | #344 | Tragic 19.7% |
| Somalis | 0.0 /100 | #345 | Tragic 19.8% |
| Immigrants | Cabo Verde | 0.0 /100 | #346 | Tragic 19.9% |
| Immigrants | Somalia | 0.0 /100 | #347 | Tragic 20.0% |