Venezuelan vs German Cognitive Disability
COMPARE
Venezuelan
German
Cognitive Disability
Cognitive Disability Comparison
Venezuelans
Germans
16.6%
COGNITIVE DISABILITY
99.6/ 100
METRIC RATING
64th/ 347
METRIC RANK
16.7%
COGNITIVE DISABILITY
99.3/ 100
METRIC RATING
72nd/ 347
METRIC RANK
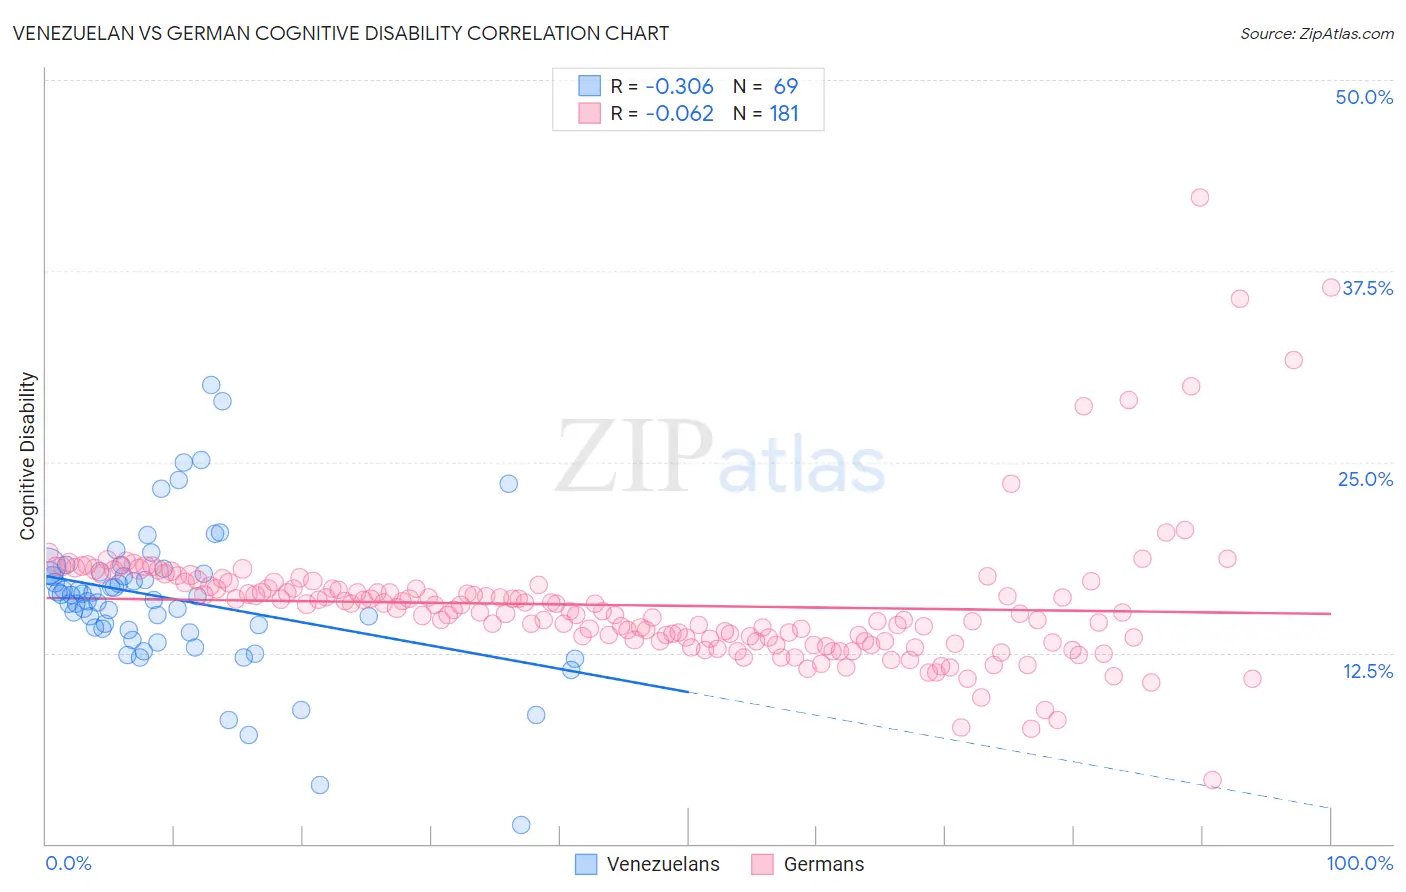
Venezuelan vs German Cognitive Disability Correlation Chart
The statistical analysis conducted on geographies consisting of 306,294,169 people shows a mild negative correlation between the proportion of Venezuelans and percentage of population with cognitive disability in the United States with a correlation coefficient (R) of -0.306 and weighted average of 16.6%. Similarly, the statistical analysis conducted on geographies consisting of 580,999,229 people shows a slight negative correlation between the proportion of Germans and percentage of population with cognitive disability in the United States with a correlation coefficient (R) of -0.062 and weighted average of 16.7%, a difference of 0.33%.
Cognitive Disability Correlation Summary
| Measurement | Venezuelan | German |
| Minimum | 1.2% | 4.2% |
| Maximum | 30.0% | 42.3% |
| Range | 28.8% | 38.1% |
| Mean | 16.0% | 15.6% |
| Median | 16.2% | 15.2% |
| Interquartile 25% (IQ1) | 13.9% | 13.3% |
| Interquartile 75% (IQ3) | 17.8% | 16.9% |
| Interquartile Range (IQR) | 3.8% | 3.7% |
| Standard Deviation (Sample) | 4.8% | 4.5% |
| Standard Deviation (Population) | 4.8% | 4.5% |
Demographics Similar to Venezuelans and Germans by Cognitive Disability
In terms of cognitive disability, the demographic groups most similar to Venezuelans are Colombian (16.6%, a difference of 0.010%), Argentinean (16.6%, a difference of 0.060%), Czechoslovakian (16.6%, a difference of 0.080%), Immigrants from England (16.6%, a difference of 0.11%), and Immigrants from Ukraine (16.6%, a difference of 0.14%). Similarly, the demographic groups most similar to Germans are Burmese (16.7%, a difference of 0.010%), Slavic (16.7%, a difference of 0.010%), Immigrants from Sweden (16.7%, a difference of 0.020%), Immigrants from Belgium (16.7%, a difference of 0.020%), and Estonian (16.7%, a difference of 0.020%).
| Demographics | Rating | Rank | Cognitive Disability |
| Pennsylvania Germans | 99.7 /100 | #58 | Exceptional 16.6% |
| Immigrants | Peru | 99.7 /100 | #59 | Exceptional 16.6% |
| Romanians | 99.7 /100 | #60 | Exceptional 16.6% |
| Immigrants | England | 99.6 /100 | #61 | Exceptional 16.6% |
| Czechoslovakians | 99.6 /100 | #62 | Exceptional 16.6% |
| Argentineans | 99.6 /100 | #63 | Exceptional 16.6% |
| Venezuelans | 99.6 /100 | #64 | Exceptional 16.6% |
| Colombians | 99.6 /100 | #65 | Exceptional 16.6% |
| Immigrants | Ukraine | 99.5 /100 | #66 | Exceptional 16.6% |
| Latvians | 99.5 /100 | #67 | Exceptional 16.6% |
| Ukrainians | 99.4 /100 | #68 | Exceptional 16.6% |
| Immigrants | Uzbekistan | 99.4 /100 | #69 | Exceptional 16.7% |
| Immigrants | Sweden | 99.4 /100 | #70 | Exceptional 16.7% |
| Immigrants | Belgium | 99.3 /100 | #71 | Exceptional 16.7% |
| Germans | 99.3 /100 | #72 | Exceptional 16.7% |
| Burmese | 99.3 /100 | #73 | Exceptional 16.7% |
| Slavs | 99.3 /100 | #74 | Exceptional 16.7% |
| Estonians | 99.3 /100 | #75 | Exceptional 16.7% |
| Immigrants | Serbia | 99.3 /100 | #76 | Exceptional 16.7% |
| Immigrants | Hungary | 99.3 /100 | #77 | Exceptional 16.7% |
| Peruvians | 99.3 /100 | #78 | Exceptional 16.7% |