Hawaiian vs Immigrants from Congo Cognitive Disability
COMPARE
Hawaiian
Immigrants from Congo
Cognitive Disability
Cognitive Disability Comparison
Hawaiians
Immigrants from Congo
17.6%
COGNITIVE DISABILITY
7.2/ 100
METRIC RATING
213th/ 347
METRIC RANK
19.7%
COGNITIVE DISABILITY
0.0/ 100
METRIC RATING
344th/ 347
METRIC RANK
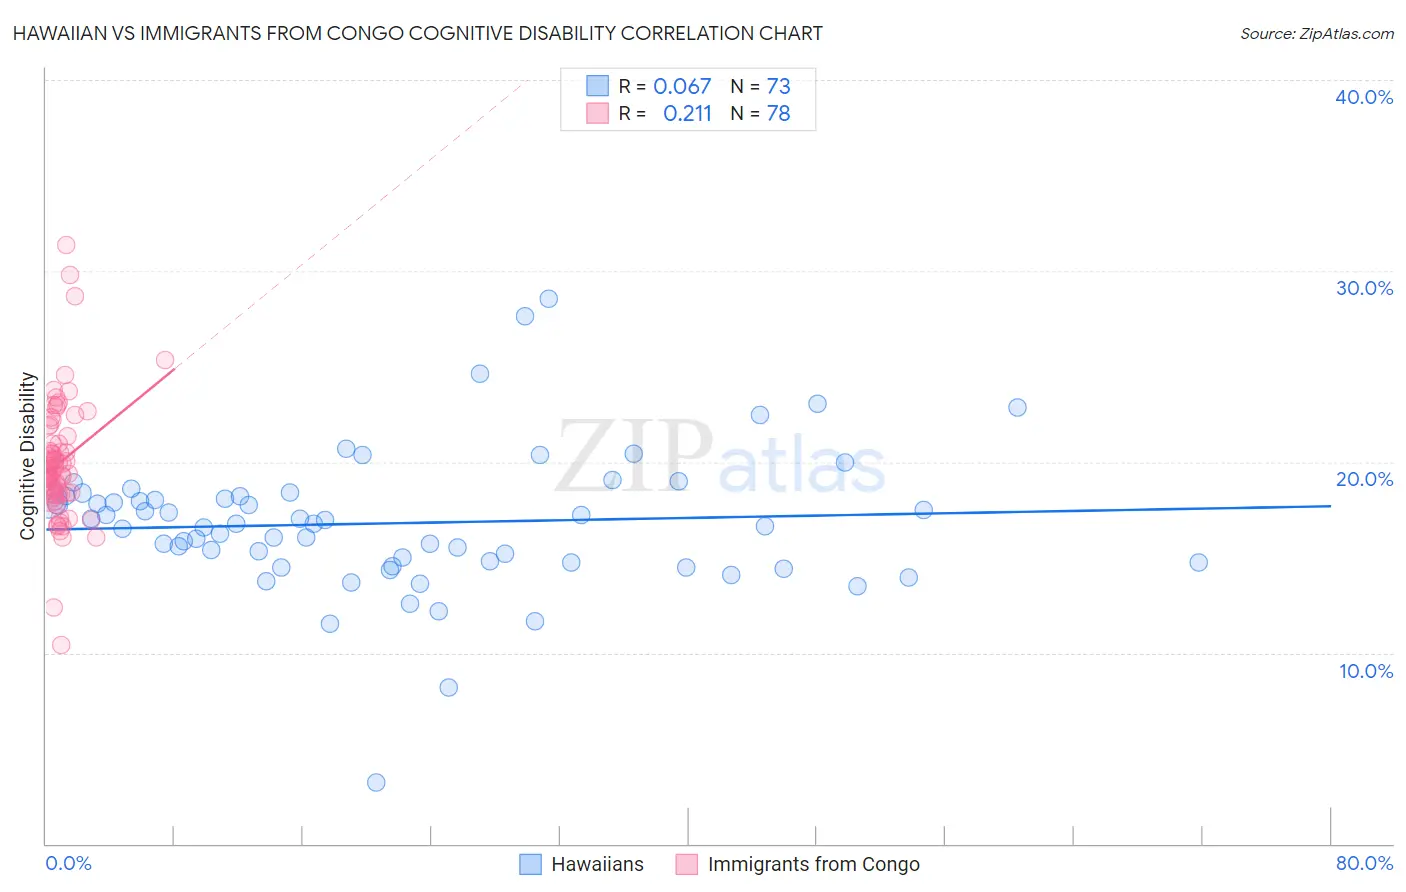
Hawaiian vs Immigrants from Congo Cognitive Disability Correlation Chart
The statistical analysis conducted on geographies consisting of 327,505,207 people shows a slight positive correlation between the proportion of Hawaiians and percentage of population with cognitive disability in the United States with a correlation coefficient (R) of 0.067 and weighted average of 17.6%. Similarly, the statistical analysis conducted on geographies consisting of 92,118,396 people shows a weak positive correlation between the proportion of Immigrants from Congo and percentage of population with cognitive disability in the United States with a correlation coefficient (R) of 0.211 and weighted average of 19.7%, a difference of 12.1%.
Cognitive Disability Correlation Summary
| Measurement | Hawaiian | Immigrants from Congo |
| Minimum | 3.2% | 10.4% |
| Maximum | 28.6% | 31.4% |
| Range | 25.4% | 21.0% |
| Mean | 16.8% | 19.9% |
| Median | 16.8% | 19.4% |
| Interquartile 25% (IQ1) | 14.7% | 18.3% |
| Interquartile 75% (IQ3) | 18.2% | 21.0% |
| Interquartile Range (IQR) | 3.5% | 2.6% |
| Standard Deviation (Sample) | 3.7% | 3.2% |
| Standard Deviation (Population) | 3.7% | 3.2% |
Similar Demographics by Cognitive Disability
Demographics Similar to Hawaiians by Cognitive Disability
In terms of cognitive disability, the demographic groups most similar to Hawaiians are Immigrants from Oceania (17.6%, a difference of 0.010%), Immigrants from El Salvador (17.6%, a difference of 0.020%), Alaskan Athabascan (17.6%, a difference of 0.030%), Okinawan (17.6%, a difference of 0.040%), and Taiwanese (17.6%, a difference of 0.050%).
| Demographics | Rating | Rank | Cognitive Disability |
| Alaska Natives | 10.4 /100 | #206 | Poor 17.5% |
| Immigrants | Latin America | 9.7 /100 | #207 | Tragic 17.6% |
| Immigrants | Cameroon | 9.3 /100 | #208 | Tragic 17.6% |
| Immigrants | Trinidad and Tobago | 8.7 /100 | #209 | Tragic 17.6% |
| Immigrants | Jamaica | 8.5 /100 | #210 | Tragic 17.6% |
| Taiwanese | 7.7 /100 | #211 | Tragic 17.6% |
| Immigrants | Oceania | 7.3 /100 | #212 | Tragic 17.6% |
| Hawaiians | 7.2 /100 | #213 | Tragic 17.6% |
| Immigrants | El Salvador | 7.0 /100 | #214 | Tragic 17.6% |
| Alaskan Athabascans | 6.9 /100 | #215 | Tragic 17.6% |
| Okinawans | 6.8 /100 | #216 | Tragic 17.6% |
| Salvadorans | 6.7 /100 | #217 | Tragic 17.6% |
| Icelanders | 6.4 /100 | #218 | Tragic 17.6% |
| Immigrants | Sierra Leone | 6.3 /100 | #219 | Tragic 17.6% |
| Zimbabweans | 6.1 /100 | #220 | Tragic 17.6% |
Demographics Similar to Immigrants from Congo by Cognitive Disability
In terms of cognitive disability, the demographic groups most similar to Immigrants from Congo are Somali (19.8%, a difference of 0.56%), Immigrants from Cabo Verde (19.9%, a difference of 0.72%), Immigrants from Somalia (20.0%, a difference of 1.5%), Immigrants from Zaire (19.4%, a difference of 1.6%), and Tohono O'odham (19.3%, a difference of 2.3%).
| Demographics | Rating | Rank | Cognitive Disability |
| Immigrants | Yemen | 0.0 /100 | #333 | Tragic 18.8% |
| Sudanese | 0.0 /100 | #334 | Tragic 18.9% |
| Senegalese | 0.0 /100 | #335 | Tragic 19.0% |
| Blacks/African Americans | 0.0 /100 | #336 | Tragic 19.0% |
| Immigrants | Saudi Arabia | 0.0 /100 | #337 | Tragic 19.1% |
| Lumbee | 0.0 /100 | #338 | Tragic 19.1% |
| Puerto Ricans | 0.0 /100 | #339 | Tragic 19.2% |
| Cape Verdeans | 0.0 /100 | #340 | Tragic 19.2% |
| Tohono O'odham | 0.0 /100 | #341 | Tragic 19.3% |
| Houma | 0.0 /100 | #342 | Tragic 19.3% |
| Immigrants | Zaire | 0.0 /100 | #343 | Tragic 19.4% |
| Immigrants | Congo | 0.0 /100 | #344 | Tragic 19.7% |
| Somalis | 0.0 /100 | #345 | Tragic 19.8% |
| Immigrants | Cabo Verde | 0.0 /100 | #346 | Tragic 19.9% |
| Immigrants | Somalia | 0.0 /100 | #347 | Tragic 20.0% |