Venezuelan vs Maltese Cognitive Disability
COMPARE
Venezuelan
Maltese
Cognitive Disability
Cognitive Disability Comparison
Venezuelans
Maltese
16.6%
COGNITIVE DISABILITY
99.6/ 100
METRIC RATING
64th/ 347
METRIC RANK
16.2%
COGNITIVE DISABILITY
100.0/ 100
METRIC RATING
12th/ 347
METRIC RANK
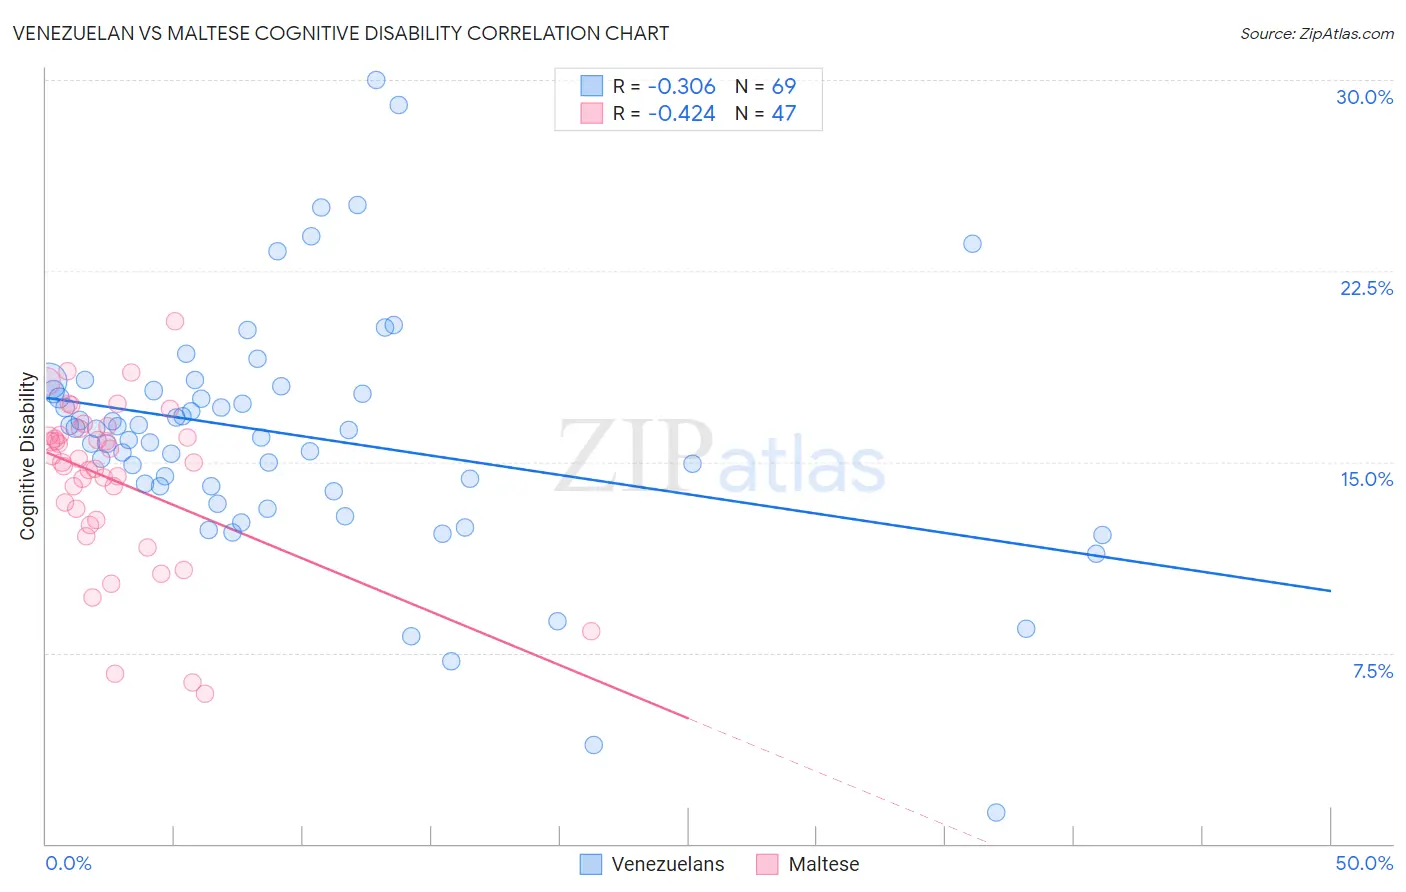
Venezuelan vs Maltese Cognitive Disability Correlation Chart
The statistical analysis conducted on geographies consisting of 306,294,169 people shows a mild negative correlation between the proportion of Venezuelans and percentage of population with cognitive disability in the United States with a correlation coefficient (R) of -0.306 and weighted average of 16.6%. Similarly, the statistical analysis conducted on geographies consisting of 126,468,065 people shows a moderate negative correlation between the proportion of Maltese and percentage of population with cognitive disability in the United States with a correlation coefficient (R) of -0.424 and weighted average of 16.2%, a difference of 2.3%.
Cognitive Disability Correlation Summary
| Measurement | Venezuelan | Maltese |
| Minimum | 1.2% | 5.9% |
| Maximum | 30.0% | 20.5% |
| Range | 28.8% | 14.6% |
| Mean | 16.0% | 14.3% |
| Median | 16.2% | 15.0% |
| Interquartile 25% (IQ1) | 13.9% | 12.7% |
| Interquartile 75% (IQ3) | 17.8% | 16.1% |
| Interquartile Range (IQR) | 3.8% | 3.4% |
| Standard Deviation (Sample) | 4.8% | 3.2% |
| Standard Deviation (Population) | 4.8% | 3.2% |
Similar Demographics by Cognitive Disability
Demographics Similar to Venezuelans by Cognitive Disability
In terms of cognitive disability, the demographic groups most similar to Venezuelans are Colombian (16.6%, a difference of 0.010%), Argentinean (16.6%, a difference of 0.060%), Czechoslovakian (16.6%, a difference of 0.080%), Immigrants from England (16.6%, a difference of 0.11%), and Immigrants from Ukraine (16.6%, a difference of 0.14%).
| Demographics | Rating | Rank | Cognitive Disability |
| Bhutanese | 99.7 /100 | #57 | Exceptional 16.6% |
| Pennsylvania Germans | 99.7 /100 | #58 | Exceptional 16.6% |
| Immigrants | Peru | 99.7 /100 | #59 | Exceptional 16.6% |
| Romanians | 99.7 /100 | #60 | Exceptional 16.6% |
| Immigrants | England | 99.6 /100 | #61 | Exceptional 16.6% |
| Czechoslovakians | 99.6 /100 | #62 | Exceptional 16.6% |
| Argentineans | 99.6 /100 | #63 | Exceptional 16.6% |
| Venezuelans | 99.6 /100 | #64 | Exceptional 16.6% |
| Colombians | 99.6 /100 | #65 | Exceptional 16.6% |
| Immigrants | Ukraine | 99.5 /100 | #66 | Exceptional 16.6% |
| Latvians | 99.5 /100 | #67 | Exceptional 16.6% |
| Ukrainians | 99.4 /100 | #68 | Exceptional 16.6% |
| Immigrants | Uzbekistan | 99.4 /100 | #69 | Exceptional 16.7% |
| Immigrants | Sweden | 99.4 /100 | #70 | Exceptional 16.7% |
| Immigrants | Belgium | 99.3 /100 | #71 | Exceptional 16.7% |
Demographics Similar to Maltese by Cognitive Disability
In terms of cognitive disability, the demographic groups most similar to Maltese are Lithuanian (16.3%, a difference of 0.090%), Immigrants from Austria (16.3%, a difference of 0.15%), Immigrants from Czechoslovakia (16.2%, a difference of 0.16%), Immigrants from Greece (16.3%, a difference of 0.18%), and Immigrants from Scotland (16.2%, a difference of 0.25%).
| Demographics | Rating | Rank | Cognitive Disability |
| Immigrants | Hong Kong | 100.0 /100 | #5 | Exceptional 16.0% |
| Thais | 100.0 /100 | #6 | Exceptional 16.1% |
| Immigrants | Ireland | 100.0 /100 | #7 | Exceptional 16.1% |
| Immigrants | Poland | 100.0 /100 | #8 | Exceptional 16.1% |
| Assyrians/Chaldeans/Syriacs | 100.0 /100 | #9 | Exceptional 16.2% |
| Immigrants | Scotland | 100.0 /100 | #10 | Exceptional 16.2% |
| Immigrants | Czechoslovakia | 100.0 /100 | #11 | Exceptional 16.2% |
| Maltese | 100.0 /100 | #12 | Exceptional 16.2% |
| Lithuanians | 100.0 /100 | #13 | Exceptional 16.3% |
| Immigrants | Austria | 100.0 /100 | #14 | Exceptional 16.3% |
| Immigrants | Greece | 100.0 /100 | #15 | Exceptional 16.3% |
| Eastern Europeans | 100.0 /100 | #16 | Exceptional 16.3% |
| Immigrants | North Macedonia | 100.0 /100 | #17 | Exceptional 16.3% |
| Immigrants | Northern Europe | 100.0 /100 | #18 | Exceptional 16.3% |
| Immigrants | Bolivia | 100.0 /100 | #19 | Exceptional 16.3% |