Venezuelan vs Okinawan Cognitive Disability
COMPARE
Venezuelan
Okinawan
Cognitive Disability
Cognitive Disability Comparison
Venezuelans
Okinawans
16.6%
COGNITIVE DISABILITY
99.6/ 100
METRIC RATING
64th/ 347
METRIC RANK
17.6%
COGNITIVE DISABILITY
6.8/ 100
METRIC RATING
216th/ 347
METRIC RANK
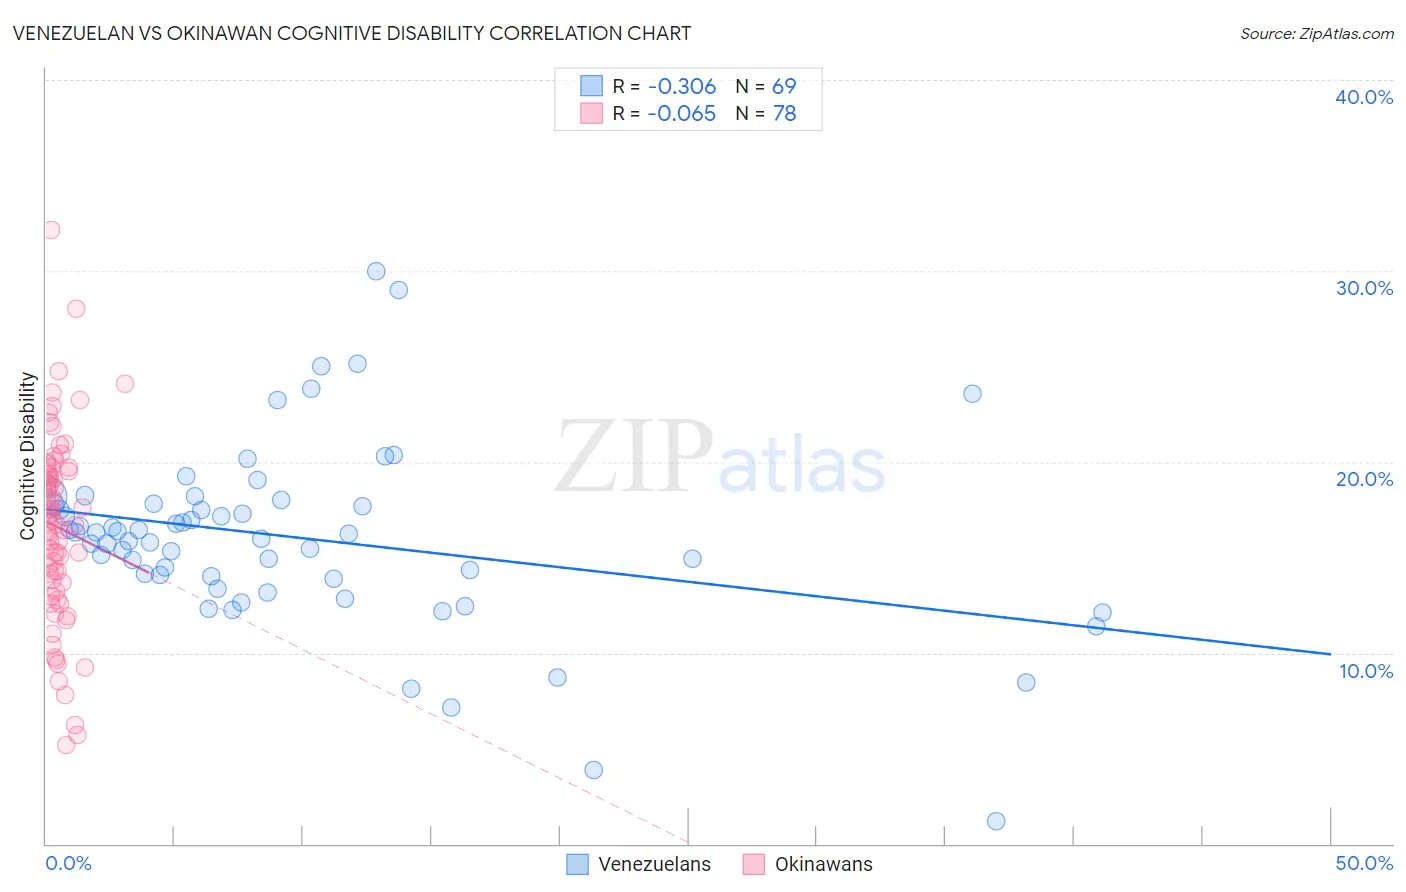
Venezuelan vs Okinawan Cognitive Disability Correlation Chart
The statistical analysis conducted on geographies consisting of 306,294,169 people shows a mild negative correlation between the proportion of Venezuelans and percentage of population with cognitive disability in the United States with a correlation coefficient (R) of -0.306 and weighted average of 16.6%. Similarly, the statistical analysis conducted on geographies consisting of 73,776,051 people shows a slight negative correlation between the proportion of Okinawans and percentage of population with cognitive disability in the United States with a correlation coefficient (R) of -0.065 and weighted average of 17.6%, a difference of 6.0%.
Cognitive Disability Correlation Summary
| Measurement | Venezuelan | Okinawan |
| Minimum | 1.2% | 5.1% |
| Maximum | 30.0% | 32.1% |
| Range | 28.8% | 27.0% |
| Mean | 16.0% | 16.6% |
| Median | 16.2% | 16.9% |
| Interquartile 25% (IQ1) | 13.9% | 13.7% |
| Interquartile 75% (IQ3) | 17.8% | 19.5% |
| Interquartile Range (IQR) | 3.8% | 5.8% |
| Standard Deviation (Sample) | 4.8% | 4.9% |
| Standard Deviation (Population) | 4.8% | 4.9% |
Similar Demographics by Cognitive Disability
Demographics Similar to Venezuelans by Cognitive Disability
In terms of cognitive disability, the demographic groups most similar to Venezuelans are Colombian (16.6%, a difference of 0.010%), Argentinean (16.6%, a difference of 0.060%), Czechoslovakian (16.6%, a difference of 0.080%), Immigrants from England (16.6%, a difference of 0.11%), and Immigrants from Ukraine (16.6%, a difference of 0.14%).
| Demographics | Rating | Rank | Cognitive Disability |
| Bhutanese | 99.7 /100 | #57 | Exceptional 16.6% |
| Pennsylvania Germans | 99.7 /100 | #58 | Exceptional 16.6% |
| Immigrants | Peru | 99.7 /100 | #59 | Exceptional 16.6% |
| Romanians | 99.7 /100 | #60 | Exceptional 16.6% |
| Immigrants | England | 99.6 /100 | #61 | Exceptional 16.6% |
| Czechoslovakians | 99.6 /100 | #62 | Exceptional 16.6% |
| Argentineans | 99.6 /100 | #63 | Exceptional 16.6% |
| Venezuelans | 99.6 /100 | #64 | Exceptional 16.6% |
| Colombians | 99.6 /100 | #65 | Exceptional 16.6% |
| Immigrants | Ukraine | 99.5 /100 | #66 | Exceptional 16.6% |
| Latvians | 99.5 /100 | #67 | Exceptional 16.6% |
| Ukrainians | 99.4 /100 | #68 | Exceptional 16.6% |
| Immigrants | Uzbekistan | 99.4 /100 | #69 | Exceptional 16.7% |
| Immigrants | Sweden | 99.4 /100 | #70 | Exceptional 16.7% |
| Immigrants | Belgium | 99.3 /100 | #71 | Exceptional 16.7% |
Demographics Similar to Okinawans by Cognitive Disability
In terms of cognitive disability, the demographic groups most similar to Okinawans are Alaskan Athabascan (17.6%, a difference of 0.010%), Immigrants from El Salvador (17.6%, a difference of 0.020%), Salvadoran (17.6%, a difference of 0.020%), Hawaiian (17.6%, a difference of 0.040%), and Immigrants from Oceania (17.6%, a difference of 0.050%).
| Demographics | Rating | Rank | Cognitive Disability |
| Immigrants | Trinidad and Tobago | 8.7 /100 | #209 | Tragic 17.6% |
| Immigrants | Jamaica | 8.5 /100 | #210 | Tragic 17.6% |
| Taiwanese | 7.7 /100 | #211 | Tragic 17.6% |
| Immigrants | Oceania | 7.3 /100 | #212 | Tragic 17.6% |
| Hawaiians | 7.2 /100 | #213 | Tragic 17.6% |
| Immigrants | El Salvador | 7.0 /100 | #214 | Tragic 17.6% |
| Alaskan Athabascans | 6.9 /100 | #215 | Tragic 17.6% |
| Okinawans | 6.8 /100 | #216 | Tragic 17.6% |
| Salvadorans | 6.7 /100 | #217 | Tragic 17.6% |
| Icelanders | 6.4 /100 | #218 | Tragic 17.6% |
| Immigrants | Sierra Leone | 6.3 /100 | #219 | Tragic 17.6% |
| Zimbabweans | 6.1 /100 | #220 | Tragic 17.6% |
| Moroccans | 5.9 /100 | #221 | Tragic 17.6% |
| Central Americans | 4.5 /100 | #222 | Tragic 17.7% |
| Alsatians | 4.5 /100 | #223 | Tragic 17.7% |