Jordanian vs Immigrants from Congo Cognitive Disability
COMPARE
Jordanian
Immigrants from Congo
Cognitive Disability
Cognitive Disability Comparison
Jordanians
Immigrants from Congo
16.8%
COGNITIVE DISABILITY
98.2/ 100
METRIC RATING
99th/ 347
METRIC RANK
19.7%
COGNITIVE DISABILITY
0.0/ 100
METRIC RATING
344th/ 347
METRIC RANK
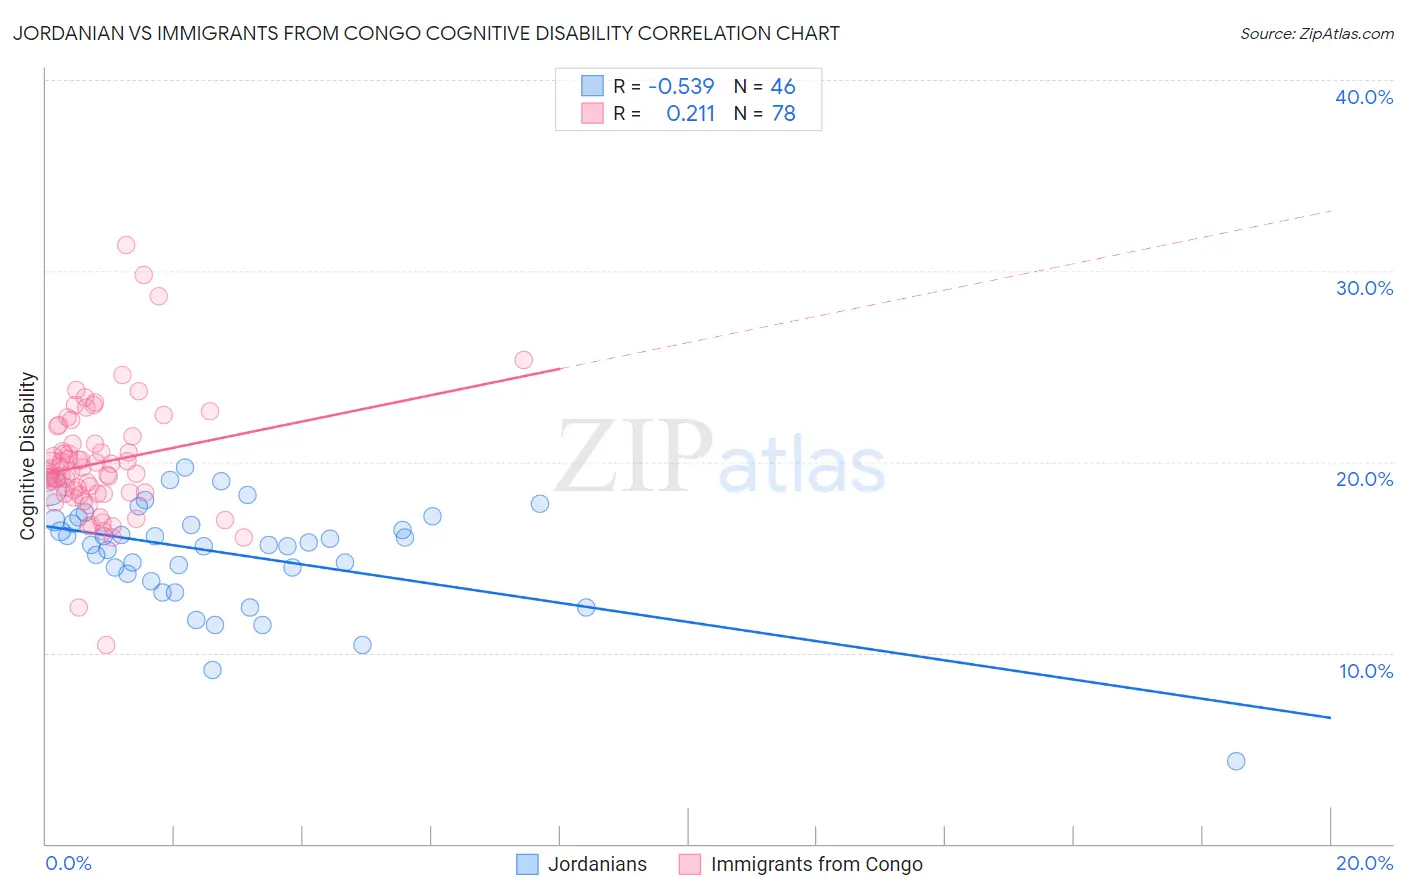
Jordanian vs Immigrants from Congo Cognitive Disability Correlation Chart
The statistical analysis conducted on geographies consisting of 166,416,373 people shows a substantial negative correlation between the proportion of Jordanians and percentage of population with cognitive disability in the United States with a correlation coefficient (R) of -0.539 and weighted average of 16.8%. Similarly, the statistical analysis conducted on geographies consisting of 92,118,396 people shows a weak positive correlation between the proportion of Immigrants from Congo and percentage of population with cognitive disability in the United States with a correlation coefficient (R) of 0.211 and weighted average of 19.7%, a difference of 17.4%.
Cognitive Disability Correlation Summary
| Measurement | Jordanian | Immigrants from Congo |
| Minimum | 4.3% | 10.4% |
| Maximum | 19.7% | 31.4% |
| Range | 15.3% | 21.0% |
| Mean | 15.2% | 19.9% |
| Median | 15.7% | 19.4% |
| Interquartile 25% (IQ1) | 14.1% | 18.3% |
| Interquartile 75% (IQ3) | 16.9% | 21.0% |
| Interquartile Range (IQR) | 2.8% | 2.6% |
| Standard Deviation (Sample) | 2.9% | 3.2% |
| Standard Deviation (Population) | 2.8% | 3.2% |
Similar Demographics by Cognitive Disability
Demographics Similar to Jordanians by Cognitive Disability
In terms of cognitive disability, the demographic groups most similar to Jordanians are Immigrants from Russia (16.8%, a difference of 0.030%), Immigrants from Asia (16.8%, a difference of 0.040%), Irish (16.8%, a difference of 0.060%), Immigrants from Lebanon (16.8%, a difference of 0.090%), and Dutch (16.8%, a difference of 0.11%).
| Demographics | Rating | Rank | Cognitive Disability |
| Immigrants | South America | 98.8 /100 | #92 | Exceptional 16.7% |
| Immigrants | Southern Europe | 98.7 /100 | #93 | Exceptional 16.7% |
| Asians | 98.7 /100 | #94 | Exceptional 16.7% |
| English | 98.6 /100 | #95 | Exceptional 16.8% |
| Finns | 98.5 /100 | #96 | Exceptional 16.8% |
| Dutch | 98.5 /100 | #97 | Exceptional 16.8% |
| Immigrants | Lebanon | 98.4 /100 | #98 | Exceptional 16.8% |
| Jordanians | 98.2 /100 | #99 | Exceptional 16.8% |
| Immigrants | Russia | 98.2 /100 | #100 | Exceptional 16.8% |
| Immigrants | Asia | 98.1 /100 | #101 | Exceptional 16.8% |
| Irish | 98.1 /100 | #102 | Exceptional 16.8% |
| Paraguayans | 98.0 /100 | #103 | Exceptional 16.8% |
| Palestinians | 98.0 /100 | #104 | Exceptional 16.8% |
| Immigrants | Eastern Asia | 97.9 /100 | #105 | Exceptional 16.8% |
| Northern Europeans | 97.8 /100 | #106 | Exceptional 16.8% |
Demographics Similar to Immigrants from Congo by Cognitive Disability
In terms of cognitive disability, the demographic groups most similar to Immigrants from Congo are Somali (19.8%, a difference of 0.56%), Immigrants from Cabo Verde (19.9%, a difference of 0.72%), Immigrants from Somalia (20.0%, a difference of 1.5%), Immigrants from Zaire (19.4%, a difference of 1.6%), and Tohono O'odham (19.3%, a difference of 2.3%).
| Demographics | Rating | Rank | Cognitive Disability |
| Immigrants | Yemen | 0.0 /100 | #333 | Tragic 18.8% |
| Sudanese | 0.0 /100 | #334 | Tragic 18.9% |
| Senegalese | 0.0 /100 | #335 | Tragic 19.0% |
| Blacks/African Americans | 0.0 /100 | #336 | Tragic 19.0% |
| Immigrants | Saudi Arabia | 0.0 /100 | #337 | Tragic 19.1% |
| Lumbee | 0.0 /100 | #338 | Tragic 19.1% |
| Puerto Ricans | 0.0 /100 | #339 | Tragic 19.2% |
| Cape Verdeans | 0.0 /100 | #340 | Tragic 19.2% |
| Tohono O'odham | 0.0 /100 | #341 | Tragic 19.3% |
| Houma | 0.0 /100 | #342 | Tragic 19.3% |
| Immigrants | Zaire | 0.0 /100 | #343 | Tragic 19.4% |
| Immigrants | Congo | 0.0 /100 | #344 | Tragic 19.7% |
| Somalis | 0.0 /100 | #345 | Tragic 19.8% |
| Immigrants | Cabo Verde | 0.0 /100 | #346 | Tragic 19.9% |
| Immigrants | Somalia | 0.0 /100 | #347 | Tragic 20.0% |