Venezuelan vs Immigrants from Dominican Republic Cognitive Disability
COMPARE
Venezuelan
Immigrants from Dominican Republic
Cognitive Disability
Cognitive Disability Comparison
Venezuelans
Immigrants from Dominican Republic
16.6%
COGNITIVE DISABILITY
99.6/ 100
METRIC RATING
64th/ 347
METRIC RANK
18.8%
COGNITIVE DISABILITY
0.0/ 100
METRIC RATING
330th/ 347
METRIC RANK
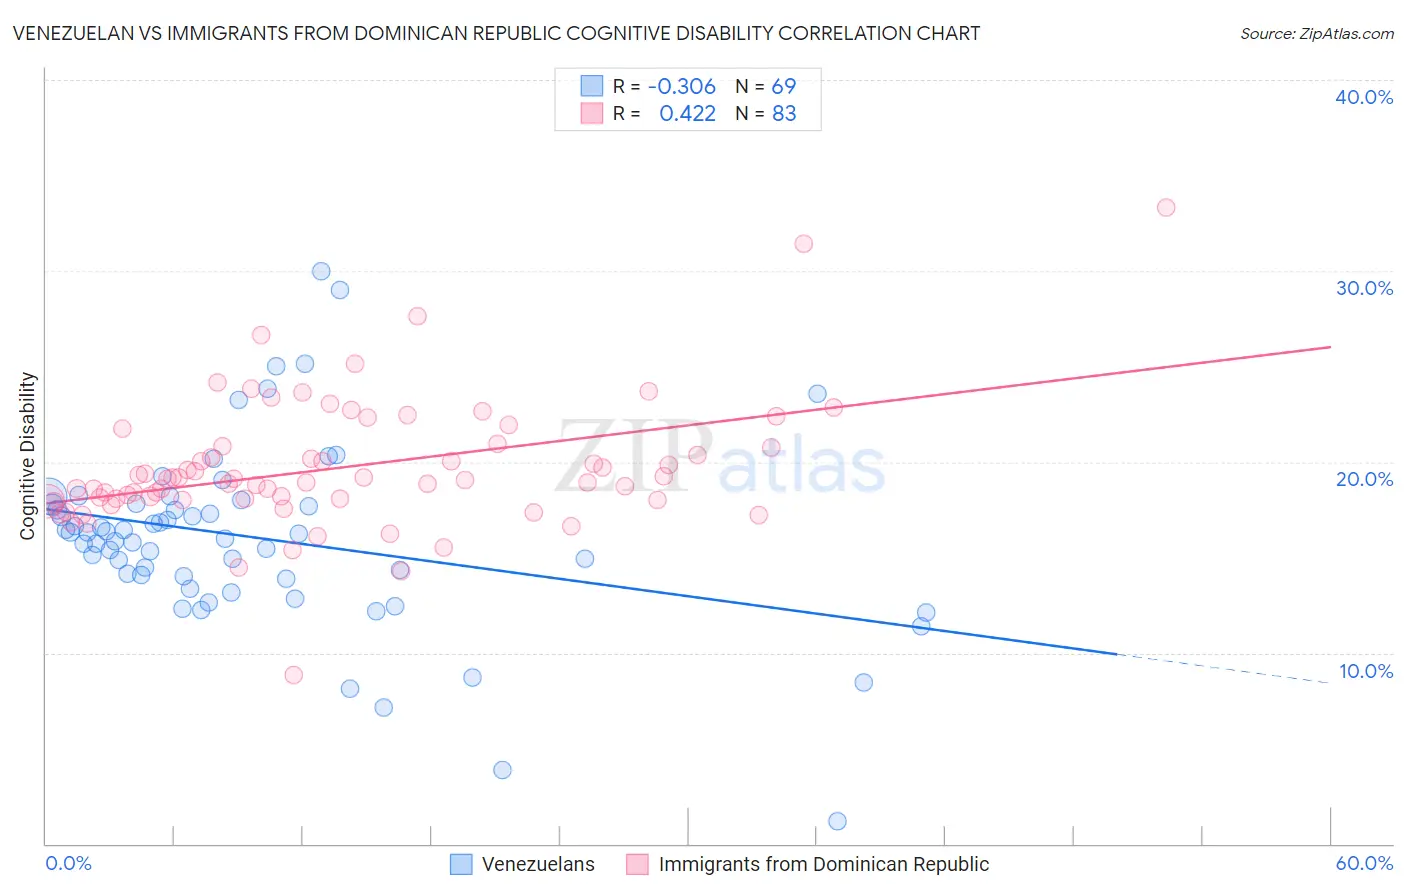
Venezuelan vs Immigrants from Dominican Republic Cognitive Disability Correlation Chart
The statistical analysis conducted on geographies consisting of 306,294,169 people shows a mild negative correlation between the proportion of Venezuelans and percentage of population with cognitive disability in the United States with a correlation coefficient (R) of -0.306 and weighted average of 16.6%. Similarly, the statistical analysis conducted on geographies consisting of 275,093,930 people shows a moderate positive correlation between the proportion of Immigrants from Dominican Republic and percentage of population with cognitive disability in the United States with a correlation coefficient (R) of 0.422 and weighted average of 18.8%, a difference of 13.1%.
Cognitive Disability Correlation Summary
| Measurement | Venezuelan | Immigrants from Dominican Republic |
| Minimum | 1.2% | 8.8% |
| Maximum | 30.0% | 33.3% |
| Range | 28.8% | 24.5% |
| Mean | 16.0% | 19.7% |
| Median | 16.2% | 19.1% |
| Interquartile 25% (IQ1) | 13.9% | 18.0% |
| Interquartile 75% (IQ3) | 17.8% | 20.8% |
| Interquartile Range (IQR) | 3.8% | 2.8% |
| Standard Deviation (Sample) | 4.8% | 3.4% |
| Standard Deviation (Population) | 4.8% | 3.4% |
Similar Demographics by Cognitive Disability
Demographics Similar to Venezuelans by Cognitive Disability
In terms of cognitive disability, the demographic groups most similar to Venezuelans are Colombian (16.6%, a difference of 0.010%), Argentinean (16.6%, a difference of 0.060%), Czechoslovakian (16.6%, a difference of 0.080%), Immigrants from England (16.6%, a difference of 0.11%), and Immigrants from Ukraine (16.6%, a difference of 0.14%).
| Demographics | Rating | Rank | Cognitive Disability |
| Bhutanese | 99.7 /100 | #57 | Exceptional 16.6% |
| Pennsylvania Germans | 99.7 /100 | #58 | Exceptional 16.6% |
| Immigrants | Peru | 99.7 /100 | #59 | Exceptional 16.6% |
| Romanians | 99.7 /100 | #60 | Exceptional 16.6% |
| Immigrants | England | 99.6 /100 | #61 | Exceptional 16.6% |
| Czechoslovakians | 99.6 /100 | #62 | Exceptional 16.6% |
| Argentineans | 99.6 /100 | #63 | Exceptional 16.6% |
| Venezuelans | 99.6 /100 | #64 | Exceptional 16.6% |
| Colombians | 99.6 /100 | #65 | Exceptional 16.6% |
| Immigrants | Ukraine | 99.5 /100 | #66 | Exceptional 16.6% |
| Latvians | 99.5 /100 | #67 | Exceptional 16.6% |
| Ukrainians | 99.4 /100 | #68 | Exceptional 16.6% |
| Immigrants | Uzbekistan | 99.4 /100 | #69 | Exceptional 16.7% |
| Immigrants | Sweden | 99.4 /100 | #70 | Exceptional 16.7% |
| Immigrants | Belgium | 99.3 /100 | #71 | Exceptional 16.7% |
Demographics Similar to Immigrants from Dominican Republic by Cognitive Disability
In terms of cognitive disability, the demographic groups most similar to Immigrants from Dominican Republic are Pima (18.8%, a difference of 0.070%), Immigrants from Sudan (18.8%, a difference of 0.080%), Navajo (18.8%, a difference of 0.10%), Immigrants from Yemen (18.8%, a difference of 0.14%), and Kiowa (18.7%, a difference of 0.32%).
| Demographics | Rating | Rank | Cognitive Disability |
| Pueblo | 0.0 /100 | #323 | Tragic 18.7% |
| Dominicans | 0.0 /100 | #324 | Tragic 18.7% |
| Indonesians | 0.0 /100 | #325 | Tragic 18.7% |
| Immigrants | Senegal | 0.0 /100 | #326 | Tragic 18.7% |
| U.S. Virgin Islanders | 0.0 /100 | #327 | Tragic 18.7% |
| Kiowa | 0.0 /100 | #328 | Tragic 18.7% |
| Navajo | 0.0 /100 | #329 | Tragic 18.8% |
| Immigrants | Dominican Republic | 0.0 /100 | #330 | Tragic 18.8% |
| Pima | 0.0 /100 | #331 | Tragic 18.8% |
| Immigrants | Sudan | 0.0 /100 | #332 | Tragic 18.8% |
| Immigrants | Yemen | 0.0 /100 | #333 | Tragic 18.8% |
| Sudanese | 0.0 /100 | #334 | Tragic 18.9% |
| Senegalese | 0.0 /100 | #335 | Tragic 19.0% |
| Blacks/African Americans | 0.0 /100 | #336 | Tragic 19.0% |
| Immigrants | Saudi Arabia | 0.0 /100 | #337 | Tragic 19.1% |