Ute vs Immigrants from Switzerland Male Disability
COMPARE
Ute
Immigrants from Switzerland
Male Disability
Male Disability Comparison
Ute
Immigrants from Switzerland
11.6%
MALE DISABILITY
9.4/ 100
METRIC RATING
210th/ 347
METRIC RANK
10.7%
MALE DISABILITY
96.1/ 100
METRIC RATING
99th/ 347
METRIC RANK
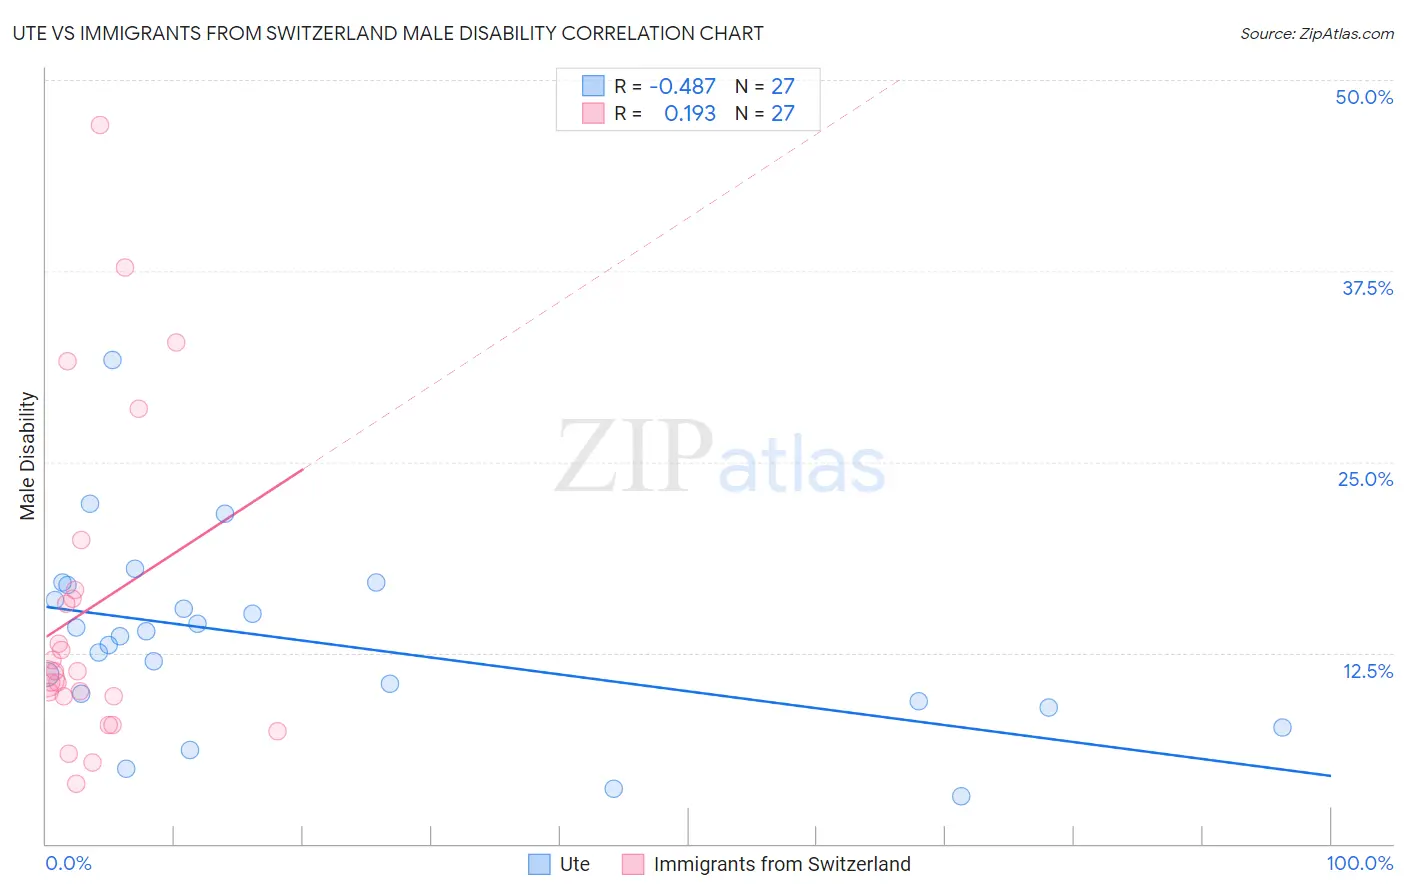
Ute vs Immigrants from Switzerland Male Disability Correlation Chart
The statistical analysis conducted on geographies consisting of 55,667,753 people shows a moderate negative correlation between the proportion of Ute and percentage of males with a disability in the United States with a correlation coefficient (R) of -0.487 and weighted average of 11.6%. Similarly, the statistical analysis conducted on geographies consisting of 148,082,366 people shows a poor positive correlation between the proportion of Immigrants from Switzerland and percentage of males with a disability in the United States with a correlation coefficient (R) of 0.193 and weighted average of 10.7%, a difference of 7.9%.
Male Disability Correlation Summary
| Measurement | Ute | Immigrants from Switzerland |
| Minimum | 3.1% | 4.0% |
| Maximum | 31.7% | 47.1% |
| Range | 28.5% | 43.1% |
| Mean | 13.3% | 15.4% |
| Median | 13.6% | 11.3% |
| Interquartile 25% (IQ1) | 9.3% | 9.6% |
| Interquartile 75% (IQ3) | 16.9% | 16.6% |
| Interquartile Range (IQR) | 7.6% | 7.0% |
| Standard Deviation (Sample) | 6.1% | 10.8% |
| Standard Deviation (Population) | 6.0% | 10.6% |
Similar Demographics by Male Disability
Demographics Similar to Ute by Male Disability
In terms of male disability, the demographic groups most similar to Ute are Spanish American Indian (11.6%, a difference of 0.10%), Icelander (11.6%, a difference of 0.11%), Immigrants from Somalia (11.5%, a difference of 0.15%), Immigrants from Thailand (11.6%, a difference of 0.17%), and Ukrainian (11.5%, a difference of 0.18%).
| Demographics | Rating | Rank | Male Disability |
| Jamaicans | 10.9 /100 | #203 | Poor 11.5% |
| Immigrants | Cambodia | 10.8 /100 | #204 | Poor 11.5% |
| Serbians | 10.7 /100 | #205 | Poor 11.5% |
| Ukrainians | 10.6 /100 | #206 | Poor 11.5% |
| Immigrants | Somalia | 10.4 /100 | #207 | Poor 11.5% |
| Icelanders | 10.1 /100 | #208 | Poor 11.6% |
| Spanish American Indians | 10.1 /100 | #209 | Poor 11.6% |
| Ute | 9.4 /100 | #210 | Tragic 11.6% |
| Immigrants | Thailand | 8.4 /100 | #211 | Tragic 11.6% |
| Immigrants | Scotland | 8.2 /100 | #212 | Tragic 11.6% |
| Mexican American Indians | 7.8 /100 | #213 | Tragic 11.6% |
| Lithuanians | 6.6 /100 | #214 | Tragic 11.6% |
| Indonesians | 5.9 /100 | #215 | Tragic 11.6% |
| Immigrants | Dominican Republic | 4.9 /100 | #216 | Tragic 11.7% |
| Immigrants | Dominica | 4.6 /100 | #217 | Tragic 11.7% |
Demographics Similar to Immigrants from Switzerland by Male Disability
In terms of male disability, the demographic groups most similar to Immigrants from Switzerland are Immigrants from Kazakhstan (10.7%, a difference of 0.070%), Immigrants from Romania (10.7%, a difference of 0.14%), Immigrants from Greece (10.7%, a difference of 0.18%), Immigrants from Armenia (10.7%, a difference of 0.20%), and Nicaraguan (10.7%, a difference of 0.22%).
| Demographics | Rating | Rank | Male Disability |
| Palestinians | 97.4 /100 | #92 | Exceptional 10.7% |
| Immigrants | St. Vincent and the Grenadines | 97.1 /100 | #93 | Exceptional 10.7% |
| Immigrants | Sweden | 96.9 /100 | #94 | Exceptional 10.7% |
| Chileans | 96.9 /100 | #95 | Exceptional 10.7% |
| Nicaraguans | 96.6 /100 | #96 | Exceptional 10.7% |
| Immigrants | Armenia | 96.6 /100 | #97 | Exceptional 10.7% |
| Immigrants | Romania | 96.5 /100 | #98 | Exceptional 10.7% |
| Immigrants | Switzerland | 96.1 /100 | #99 | Exceptional 10.7% |
| Immigrants | Kazakhstan | 95.9 /100 | #100 | Exceptional 10.7% |
| Immigrants | Greece | 95.6 /100 | #101 | Exceptional 10.7% |
| Immigrants | Eastern Europe | 95.3 /100 | #102 | Exceptional 10.7% |
| Uruguayans | 95.3 /100 | #103 | Exceptional 10.7% |
| Immigrants | Nigeria | 95.1 /100 | #104 | Exceptional 10.8% |
| Immigrants | Brazil | 95.0 /100 | #105 | Exceptional 10.8% |
| Immigrants | Syria | 94.9 /100 | #106 | Exceptional 10.8% |