Ute vs Immigrants from Kuwait Female Disability
COMPARE
Ute
Immigrants from Kuwait
Female Disability
Female Disability Comparison
Ute
Immigrants from Kuwait
12.4%
FEMALE DISABILITY
14.7/ 100
METRIC RATING
212th/ 347
METRIC RANK
11.1%
FEMALE DISABILITY
100.0/ 100
METRIC RATING
31st/ 347
METRIC RANK
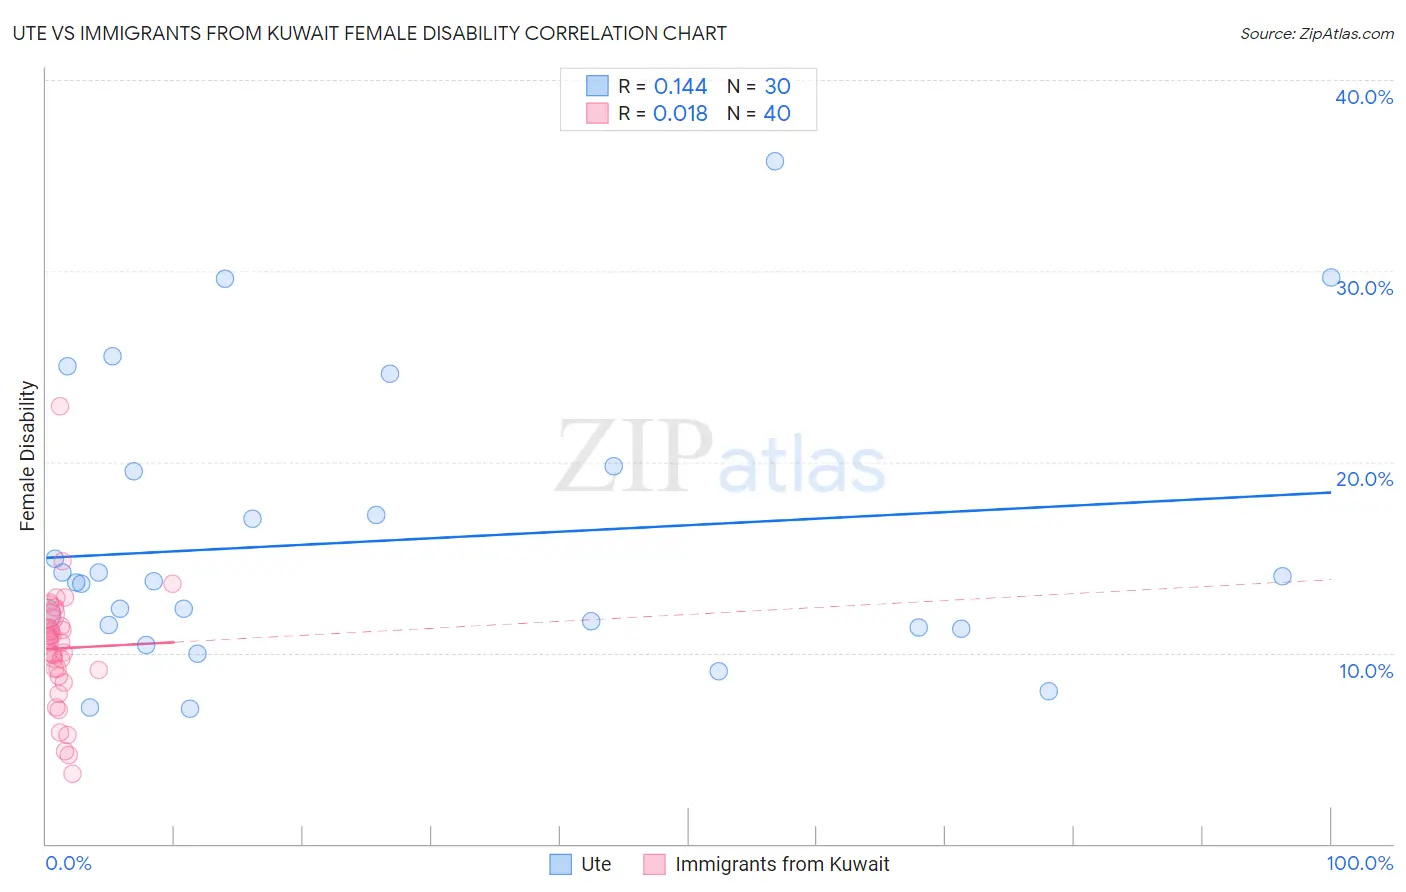
Ute vs Immigrants from Kuwait Female Disability Correlation Chart
The statistical analysis conducted on geographies consisting of 55,657,679 people shows a poor positive correlation between the proportion of Ute and percentage of females with a disability in the United States with a correlation coefficient (R) of 0.144 and weighted average of 12.4%. Similarly, the statistical analysis conducted on geographies consisting of 136,914,007 people shows no correlation between the proportion of Immigrants from Kuwait and percentage of females with a disability in the United States with a correlation coefficient (R) of 0.018 and weighted average of 11.1%, a difference of 11.6%.
Female Disability Correlation Summary
| Measurement | Ute | Immigrants from Kuwait |
| Minimum | 7.1% | 3.7% |
| Maximum | 35.7% | 22.9% |
| Range | 28.7% | 19.3% |
| Mean | 15.9% | 10.2% |
| Median | 13.7% | 10.6% |
| Interquartile 25% (IQ1) | 11.3% | 8.9% |
| Interquartile 75% (IQ3) | 19.5% | 11.6% |
| Interquartile Range (IQR) | 8.2% | 2.7% |
| Standard Deviation (Sample) | 7.3% | 3.3% |
| Standard Deviation (Population) | 7.1% | 3.2% |
Similar Demographics by Female Disability
Demographics Similar to Ute by Female Disability
In terms of female disability, the demographic groups most similar to Ute are Swiss (12.4%, a difference of 0.010%), Immigrants from Bosnia and Herzegovina (12.4%, a difference of 0.010%), Immigrants from Thailand (12.4%, a difference of 0.020%), Mexican (12.4%, a difference of 0.070%), and Panamanian (12.4%, a difference of 0.10%).
| Demographics | Rating | Rank | Female Disability |
| Immigrants | Grenada | 20.5 /100 | #205 | Fair 12.4% |
| Immigrants | Cuba | 20.2 /100 | #206 | Fair 12.4% |
| Croatians | 20.2 /100 | #207 | Fair 12.4% |
| Basques | 17.5 /100 | #208 | Poor 12.4% |
| Mexicans | 15.7 /100 | #209 | Poor 12.4% |
| Swiss | 14.9 /100 | #210 | Poor 12.4% |
| Immigrants | Bosnia and Herzegovina | 14.8 /100 | #211 | Poor 12.4% |
| Ute | 14.7 /100 | #212 | Poor 12.4% |
| Immigrants | Thailand | 14.5 /100 | #213 | Poor 12.4% |
| Panamanians | 13.5 /100 | #214 | Poor 12.4% |
| Samoans | 13.4 /100 | #215 | Poor 12.4% |
| Immigrants | Burma/Myanmar | 13.3 /100 | #216 | Poor 12.4% |
| British | 12.7 /100 | #217 | Poor 12.4% |
| Immigrants | Bahamas | 12.5 /100 | #218 | Poor 12.4% |
| Europeans | 12.1 /100 | #219 | Poor 12.4% |
Demographics Similar to Immigrants from Kuwait by Female Disability
In terms of female disability, the demographic groups most similar to Immigrants from Kuwait are Immigrants from Malaysia (11.1%, a difference of 0.10%), Turkish (11.1%, a difference of 0.10%), Egyptian (11.1%, a difference of 0.17%), Immigrants from Australia (11.1%, a difference of 0.17%), and Immigrants from Egypt (11.1%, a difference of 0.25%).
| Demographics | Rating | Rank | Female Disability |
| Immigrants | Argentina | 100.0 /100 | #24 | Exceptional 11.0% |
| Immigrants | Asia | 100.0 /100 | #25 | Exceptional 11.0% |
| Argentineans | 100.0 /100 | #26 | Exceptional 11.0% |
| Immigrants | Turkey | 100.0 /100 | #27 | Exceptional 11.1% |
| Egyptians | 100.0 /100 | #28 | Exceptional 11.1% |
| Immigrants | Malaysia | 100.0 /100 | #29 | Exceptional 11.1% |
| Turks | 100.0 /100 | #30 | Exceptional 11.1% |
| Immigrants | Kuwait | 100.0 /100 | #31 | Exceptional 11.1% |
| Immigrants | Australia | 100.0 /100 | #32 | Exceptional 11.1% |
| Immigrants | Egypt | 100.0 /100 | #33 | Exceptional 11.1% |
| Immigrants | Indonesia | 100.0 /100 | #34 | Exceptional 11.2% |
| Immigrants | Japan | 100.0 /100 | #35 | Exceptional 11.2% |
| Cypriots | 100.0 /100 | #36 | Exceptional 11.2% |
| Ethiopians | 100.0 /100 | #37 | Exceptional 11.2% |
| Immigrants | Ethiopia | 100.0 /100 | #38 | Exceptional 11.2% |