Hispanic or Latino vs Immigrants from Austria Vision Disability
COMPARE
Hispanic or Latino
Immigrants from Austria
Vision Disability
Vision Disability Comparison
Hispanics or Latinos
Immigrants from Austria
2.6%
VISION DISABILITY
0.0/ 100
METRIC RATING
305th/ 347
METRIC RANK
2.1%
VISION DISABILITY
94.4/ 100
METRIC RATING
103rd/ 347
METRIC RANK
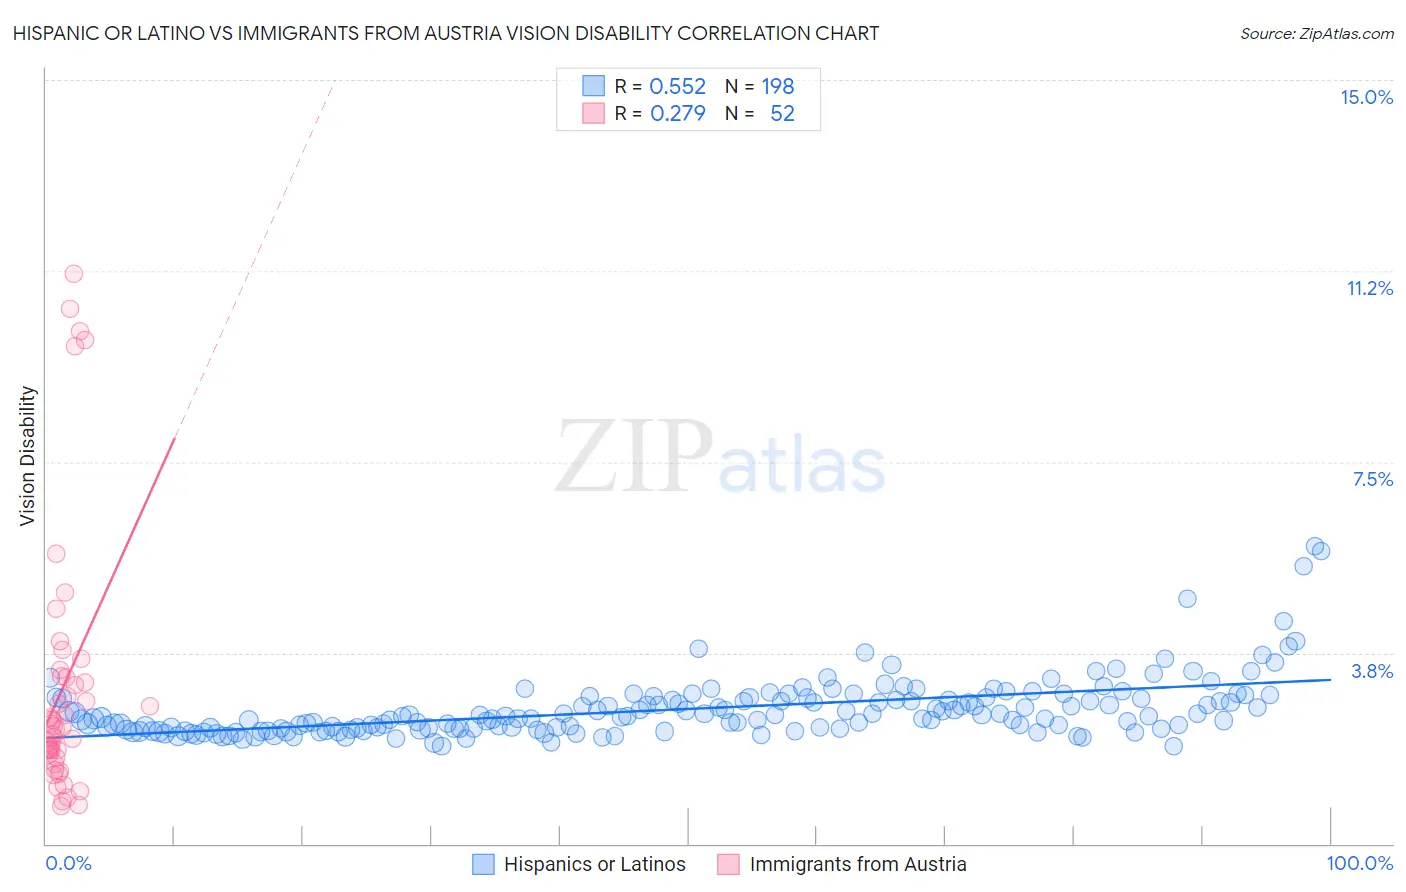
Hispanic or Latino vs Immigrants from Austria Vision Disability Correlation Chart
The statistical analysis conducted on geographies consisting of 574,500,029 people shows a substantial positive correlation between the proportion of Hispanics or Latinos and percentage of population with vision disability in the United States with a correlation coefficient (R) of 0.552 and weighted average of 2.6%. Similarly, the statistical analysis conducted on geographies consisting of 167,931,015 people shows a weak positive correlation between the proportion of Immigrants from Austria and percentage of population with vision disability in the United States with a correlation coefficient (R) of 0.279 and weighted average of 2.1%, a difference of 25.2%.
Vision Disability Correlation Summary
| Measurement | Hispanic or Latino | Immigrants from Austria |
| Minimum | 1.9% | 0.74% |
| Maximum | 5.8% | 11.2% |
| Range | 3.9% | 10.4% |
| Mean | 2.6% | 3.1% |
| Median | 2.5% | 2.3% |
| Interquartile 25% (IQ1) | 2.3% | 1.7% |
| Interquartile 75% (IQ3) | 2.9% | 3.3% |
| Interquartile Range (IQR) | 0.59% | 1.5% |
| Standard Deviation (Sample) | 0.59% | 2.6% |
| Standard Deviation (Population) | 0.59% | 2.6% |
Similar Demographics by Vision Disability
Demographics Similar to Hispanics or Latinos by Vision Disability
In terms of vision disability, the demographic groups most similar to Hispanics or Latinos are Aleut (2.6%, a difference of 0.30%), Immigrants from Cabo Verde (2.6%, a difference of 0.43%), Iroquois (2.6%, a difference of 0.61%), Immigrants from Dominican Republic (2.6%, a difference of 0.64%), and Arapaho (2.6%, a difference of 0.65%).
| Demographics | Rating | Rank | Vision Disability |
| Mexicans | 0.0 /100 | #298 | Tragic 2.5% |
| Cree | 0.0 /100 | #299 | Tragic 2.5% |
| Africans | 0.0 /100 | #300 | Tragic 2.5% |
| Menominee | 0.0 /100 | #301 | Tragic 2.5% |
| Spanish American Indians | 0.0 /100 | #302 | Tragic 2.6% |
| Immigrants | Cabo Verde | 0.0 /100 | #303 | Tragic 2.6% |
| Aleuts | 0.0 /100 | #304 | Tragic 2.6% |
| Hispanics or Latinos | 0.0 /100 | #305 | Tragic 2.6% |
| Iroquois | 0.0 /100 | #306 | Tragic 2.6% |
| Immigrants | Dominican Republic | 0.0 /100 | #307 | Tragic 2.6% |
| Arapaho | 0.0 /100 | #308 | Tragic 2.6% |
| Immigrants | Yemen | 0.0 /100 | #309 | Tragic 2.6% |
| Blackfeet | 0.0 /100 | #310 | Tragic 2.6% |
| Dominicans | 0.0 /100 | #311 | Tragic 2.6% |
| Americans | 0.0 /100 | #312 | Tragic 2.6% |
Demographics Similar to Immigrants from Austria by Vision Disability
In terms of vision disability, the demographic groups most similar to Immigrants from Austria are Immigrants from Italy (2.1%, a difference of 0.010%), Carpatho Rusyn (2.1%, a difference of 0.020%), Swedish (2.1%, a difference of 0.070%), Danish (2.1%, a difference of 0.070%), and Korean (2.1%, a difference of 0.10%).
| Demographics | Rating | Rank | Vision Disability |
| Romanians | 95.7 /100 | #96 | Exceptional 2.1% |
| Immigrants | Afghanistan | 95.6 /100 | #97 | Exceptional 2.1% |
| Immigrants | South Africa | 95.4 /100 | #98 | Exceptional 2.1% |
| Estonians | 95.3 /100 | #99 | Exceptional 2.1% |
| Greeks | 95.1 /100 | #100 | Exceptional 2.1% |
| Albanians | 94.9 /100 | #101 | Exceptional 2.1% |
| Sri Lankans | 94.8 /100 | #102 | Exceptional 2.1% |
| Immigrants | Austria | 94.4 /100 | #103 | Exceptional 2.1% |
| Immigrants | Italy | 94.4 /100 | #104 | Exceptional 2.1% |
| Carpatho Rusyns | 94.3 /100 | #105 | Exceptional 2.1% |
| Swedes | 94.2 /100 | #106 | Exceptional 2.1% |
| Danes | 94.2 /100 | #107 | Exceptional 2.1% |
| Koreans | 94.1 /100 | #108 | Exceptional 2.1% |
| Chileans | 94.0 /100 | #109 | Exceptional 2.1% |
| Immigrants | Armenia | 93.8 /100 | #110 | Exceptional 2.1% |