Ute vs Immigrants from Austria 1st Grade
COMPARE
Ute
Immigrants from Austria
1st Grade
1st Grade Comparison
Ute
Immigrants from Austria
98.2%
1ST GRADE
96.2/ 100
METRIC RATING
114th/ 347
METRIC RANK
98.3%
1ST GRADE
99.6/ 100
METRIC RATING
67th/ 347
METRIC RANK
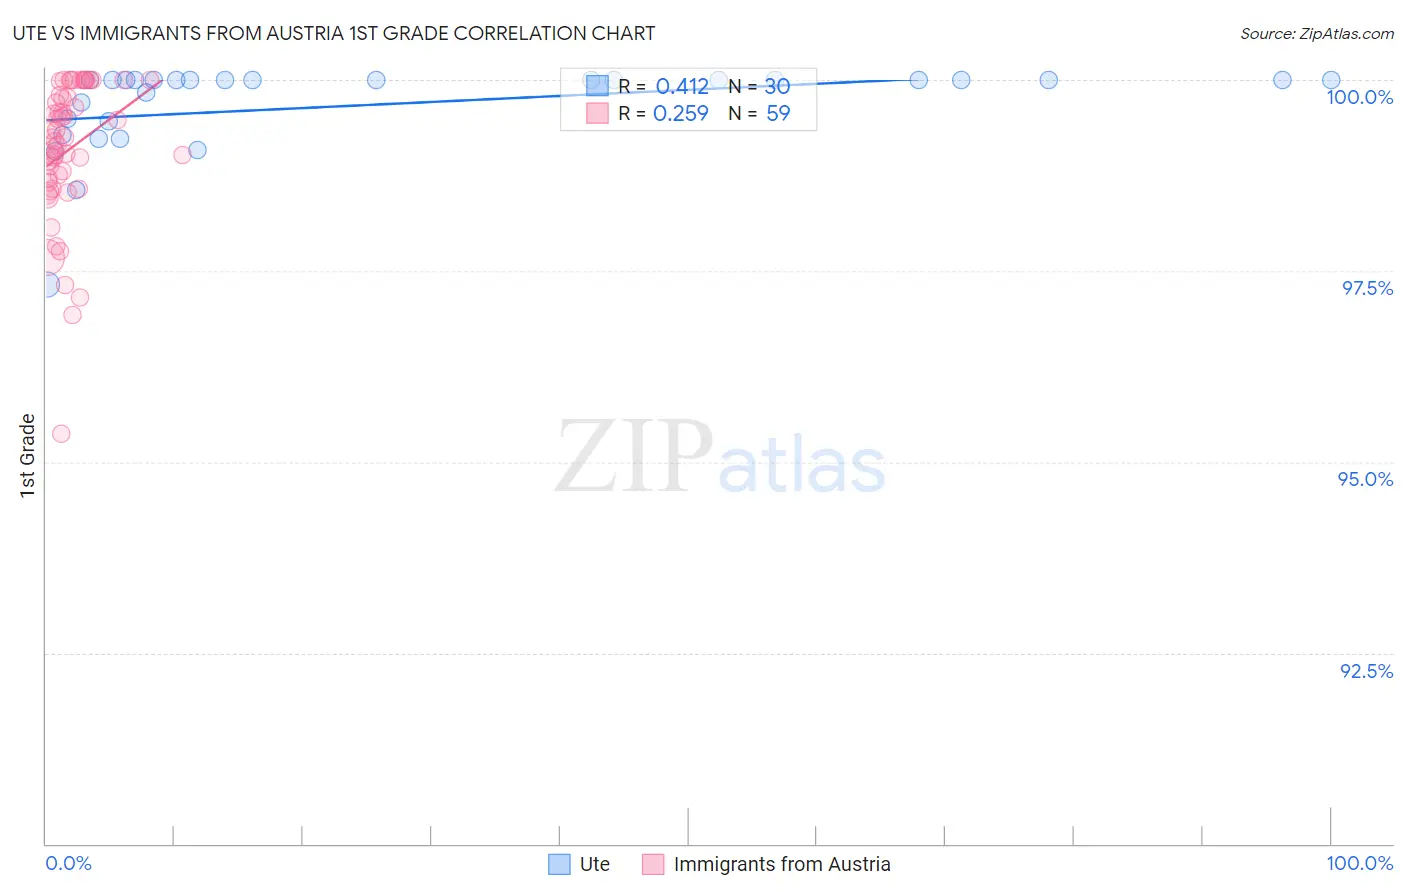
Ute vs Immigrants from Austria 1st Grade Correlation Chart
The statistical analysis conducted on geographies consisting of 55,667,712 people shows a moderate positive correlation between the proportion of Ute and percentage of population with at least 1st grade education in the United States with a correlation coefficient (R) of 0.412 and weighted average of 98.2%. Similarly, the statistical analysis conducted on geographies consisting of 167,973,800 people shows a weak positive correlation between the proportion of Immigrants from Austria and percentage of population with at least 1st grade education in the United States with a correlation coefficient (R) of 0.259 and weighted average of 98.3%, a difference of 0.18%.
1st Grade Correlation Summary
| Measurement | Ute | Immigrants from Austria |
| Minimum | 97.3% | 95.4% |
| Maximum | 100.0% | 100.0% |
| Range | 2.7% | 4.6% |
| Mean | 99.7% | 99.1% |
| Median | 100.0% | 99.2% |
| Interquartile 25% (IQ1) | 99.5% | 98.7% |
| Interquartile 75% (IQ3) | 100.0% | 99.8% |
| Interquartile Range (IQR) | 0.54% | 1.1% |
| Standard Deviation (Sample) | 0.59% | 0.92% |
| Standard Deviation (Population) | 0.58% | 0.92% |
Similar Demographics by 1st Grade
Demographics Similar to Ute by 1st Grade
In terms of 1st grade, the demographic groups most similar to Ute are Immigrants from Latvia (98.2%, a difference of 0.0%), Iranian (98.2%, a difference of 0.0%), Immigrants from Singapore (98.2%, a difference of 0.010%), Immigrants from Czechoslovakia (98.2%, a difference of 0.010%), and Immigrants from Norway (98.2%, a difference of 0.010%).
| Demographics | Rating | Rank | 1st Grade |
| Immigrants | Switzerland | 97.3 /100 | #107 | Exceptional 98.2% |
| Bhutanese | 97.3 /100 | #108 | Exceptional 98.2% |
| German Russians | 97.1 /100 | #109 | Exceptional 98.2% |
| Immigrants | Singapore | 96.7 /100 | #110 | Exceptional 98.2% |
| Immigrants | Czechoslovakia | 96.6 /100 | #111 | Exceptional 98.2% |
| Immigrants | Norway | 96.6 /100 | #112 | Exceptional 98.2% |
| Immigrants | Latvia | 96.4 /100 | #113 | Exceptional 98.2% |
| Ute | 96.2 /100 | #114 | Exceptional 98.2% |
| Iranians | 96.0 /100 | #115 | Exceptional 98.2% |
| Spanish | 95.9 /100 | #116 | Exceptional 98.2% |
| Yugoslavians | 95.5 /100 | #117 | Exceptional 98.2% |
| Immigrants | France | 95.5 /100 | #118 | Exceptional 98.2% |
| Thais | 94.7 /100 | #119 | Exceptional 98.1% |
| Okinawans | 94.5 /100 | #120 | Exceptional 98.1% |
| Immigrants | Zimbabwe | 94.0 /100 | #121 | Exceptional 98.1% |
Demographics Similar to Immigrants from Austria by 1st Grade
In terms of 1st grade, the demographic groups most similar to Immigrants from Austria are Canadian (98.3%, a difference of 0.0%), Immigrants from Northern Europe (98.3%, a difference of 0.0%), Chickasaw (98.3%, a difference of 0.0%), Russian (98.3%, a difference of 0.0%), and Maltese (98.4%, a difference of 0.010%).
| Demographics | Rating | Rank | 1st Grade |
| Immigrants | Canada | 99.7 /100 | #60 | Exceptional 98.4% |
| Bulgarians | 99.7 /100 | #61 | Exceptional 98.4% |
| Slavs | 99.7 /100 | #62 | Exceptional 98.4% |
| Immigrants | North America | 99.7 /100 | #63 | Exceptional 98.4% |
| Greeks | 99.7 /100 | #64 | Exceptional 98.4% |
| Maltese | 99.7 /100 | #65 | Exceptional 98.4% |
| Canadians | 99.6 /100 | #66 | Exceptional 98.3% |
| Immigrants | Austria | 99.6 /100 | #67 | Exceptional 98.3% |
| Immigrants | Northern Europe | 99.6 /100 | #68 | Exceptional 98.3% |
| Chickasaw | 99.6 /100 | #69 | Exceptional 98.3% |
| Russians | 99.6 /100 | #70 | Exceptional 98.3% |
| Serbians | 99.6 /100 | #71 | Exceptional 98.3% |
| Cheyenne | 99.6 /100 | #72 | Exceptional 98.3% |
| Cajuns | 99.5 /100 | #73 | Exceptional 98.3% |
| Immigrants | Netherlands | 99.4 /100 | #74 | Exceptional 98.3% |