Ute vs Immigrants from Austria Average Family Size
COMPARE
Ute
Immigrants from Austria
Average Family Size
Average Family Size Comparison
Ute
Immigrants from Austria
3.49
AVERAGE FAMILY SIZE
100.0/ 100
METRIC RATING
16th/ 347
METRIC RANK
3.12
AVERAGE FAMILY SIZE
0.0/ 100
METRIC RATING
321st/ 347
METRIC RANK
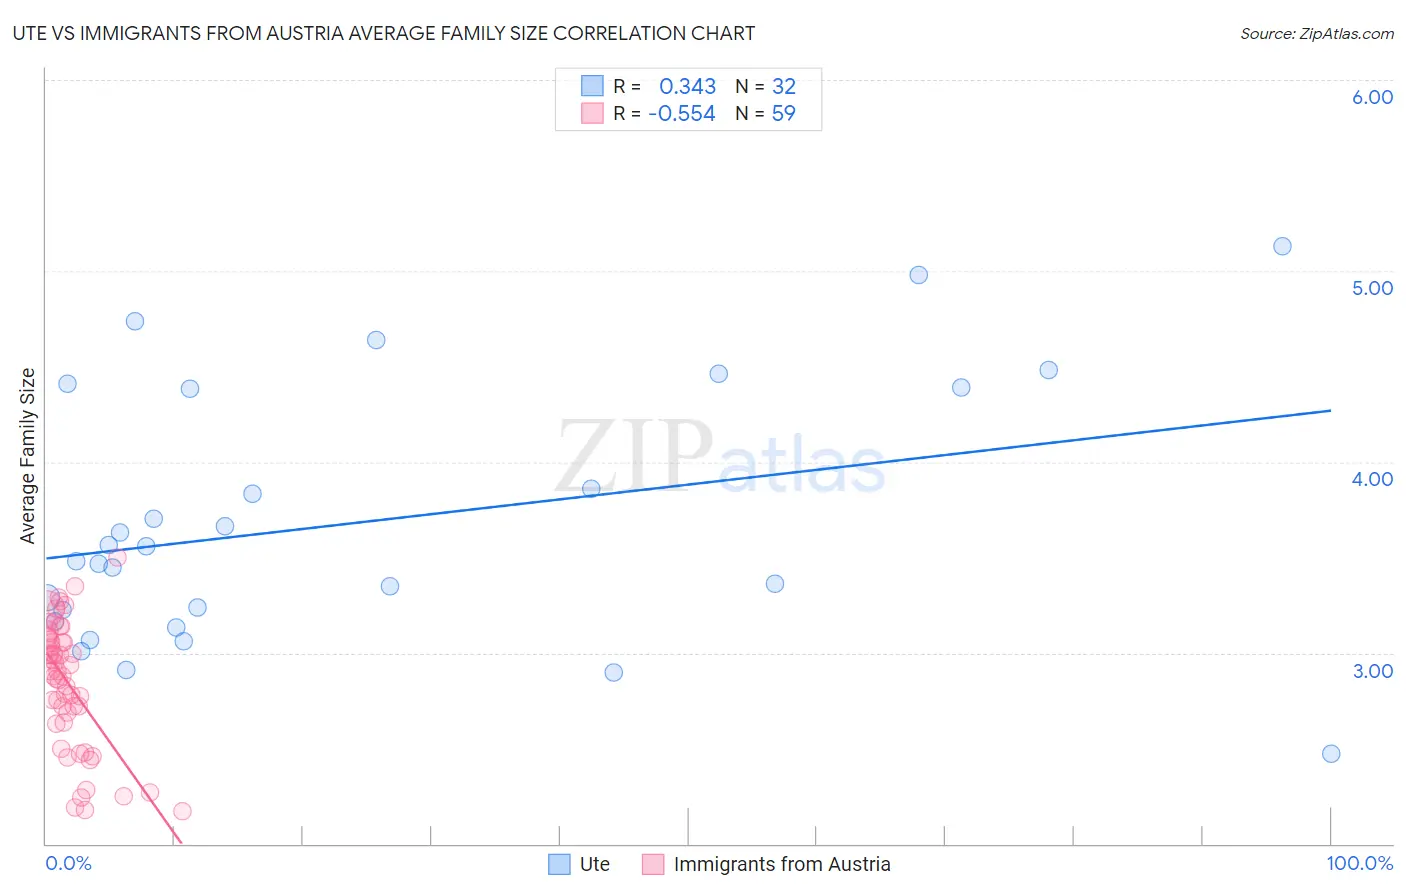
Ute vs Immigrants from Austria Average Family Size Correlation Chart
The statistical analysis conducted on geographies consisting of 55,658,636 people shows a mild positive correlation between the proportion of Ute and average family size in the United States with a correlation coefficient (R) of 0.343 and weighted average of 3.49. Similarly, the statistical analysis conducted on geographies consisting of 167,966,875 people shows a substantial negative correlation between the proportion of Immigrants from Austria and average family size in the United States with a correlation coefficient (R) of -0.554 and weighted average of 3.12, a difference of 12.0%.
Average Family Size Correlation Summary
| Measurement | Ute | Immigrants from Austria |
| Minimum | 2.47 | 2.17 |
| Maximum | 5.13 | 3.50 |
| Range | 2.66 | 1.33 |
| Mean | 3.69 | 2.84 |
| Median | 3.52 | 2.90 |
| Interquartile 25% (IQ1) | 3.19 | 2.64 |
| Interquartile 75% (IQ3) | 4.38 | 3.06 |
| Interquartile Range (IQR) | 1.19 | 0.43 |
| Standard Deviation (Sample) | 0.67 | 0.33 |
| Standard Deviation (Population) | 0.66 | 0.32 |
Similar Demographics by Average Family Size
Demographics Similar to Ute by Average Family Size
In terms of average family size, the demographic groups most similar to Ute are Tongan (3.49, a difference of 0.060%), Immigrants from El Salvador (3.49, a difference of 0.090%), Immigrants from Central America (3.49, a difference of 0.11%), Salvadoran (3.48, a difference of 0.34%), and Mexican (3.48, a difference of 0.40%).
| Demographics | Rating | Rank | Average Family Size |
| Hopi | 100.0 /100 | #9 | Exceptional 3.60 |
| Spanish American Indians | 100.0 /100 | #10 | Exceptional 3.58 |
| Tohono O'odham | 100.0 /100 | #11 | Exceptional 3.53 |
| Immigrants | Mexico | 100.0 /100 | #12 | Exceptional 3.52 |
| Sioux | 100.0 /100 | #13 | Exceptional 3.52 |
| Immigrants | Central America | 100.0 /100 | #14 | Exceptional 3.49 |
| Tongans | 100.0 /100 | #15 | Exceptional 3.49 |
| Ute | 100.0 /100 | #16 | Exceptional 3.49 |
| Immigrants | El Salvador | 100.0 /100 | #17 | Exceptional 3.49 |
| Salvadorans | 100.0 /100 | #18 | Exceptional 3.48 |
| Mexicans | 100.0 /100 | #19 | Exceptional 3.48 |
| Cheyenne | 100.0 /100 | #20 | Exceptional 3.47 |
| Yuman | 100.0 /100 | #21 | Exceptional 3.47 |
| Apache | 100.0 /100 | #22 | Exceptional 3.46 |
| Immigrants | Fiji | 100.0 /100 | #23 | Exceptional 3.45 |
Demographics Similar to Immigrants from Austria by Average Family Size
In terms of average family size, the demographic groups most similar to Immigrants from Austria are Immigrants from Canada (3.12, a difference of 0.0%), Immigrants from North America (3.12, a difference of 0.030%), Soviet Union (3.11, a difference of 0.030%), Eastern European (3.12, a difference of 0.10%), and Welsh (3.12, a difference of 0.10%).
| Demographics | Rating | Rank | Average Family Size |
| Russians | 0.1 /100 | #314 | Tragic 3.12 |
| Immigrants | Scotland | 0.1 /100 | #315 | Tragic 3.12 |
| Serbians | 0.1 /100 | #316 | Tragic 3.12 |
| Italians | 0.1 /100 | #317 | Tragic 3.12 |
| Eastern Europeans | 0.1 /100 | #318 | Tragic 3.12 |
| Welsh | 0.1 /100 | #319 | Tragic 3.12 |
| Immigrants | North America | 0.0 /100 | #320 | Tragic 3.12 |
| Immigrants | Austria | 0.0 /100 | #321 | Tragic 3.12 |
| Immigrants | Canada | 0.0 /100 | #322 | Tragic 3.12 |
| Soviet Union | 0.0 /100 | #323 | Tragic 3.11 |
| Celtics | 0.0 /100 | #324 | Tragic 3.11 |
| English | 0.0 /100 | #325 | Tragic 3.11 |
| Ottawa | 0.0 /100 | #326 | Tragic 3.11 |
| Dutch | 0.0 /100 | #327 | Tragic 3.11 |
| Czechs | 0.0 /100 | #328 | Tragic 3.11 |