Ute vs Creek Hearing Disability
COMPARE
Ute
Creek
Hearing Disability
Hearing Disability Comparison
Ute
Creek
3.5%
HEARING DISABILITY
0.1/ 100
METRIC RATING
269th/ 347
METRIC RANK
4.4%
HEARING DISABILITY
0.0/ 100
METRIC RATING
336th/ 347
METRIC RANK
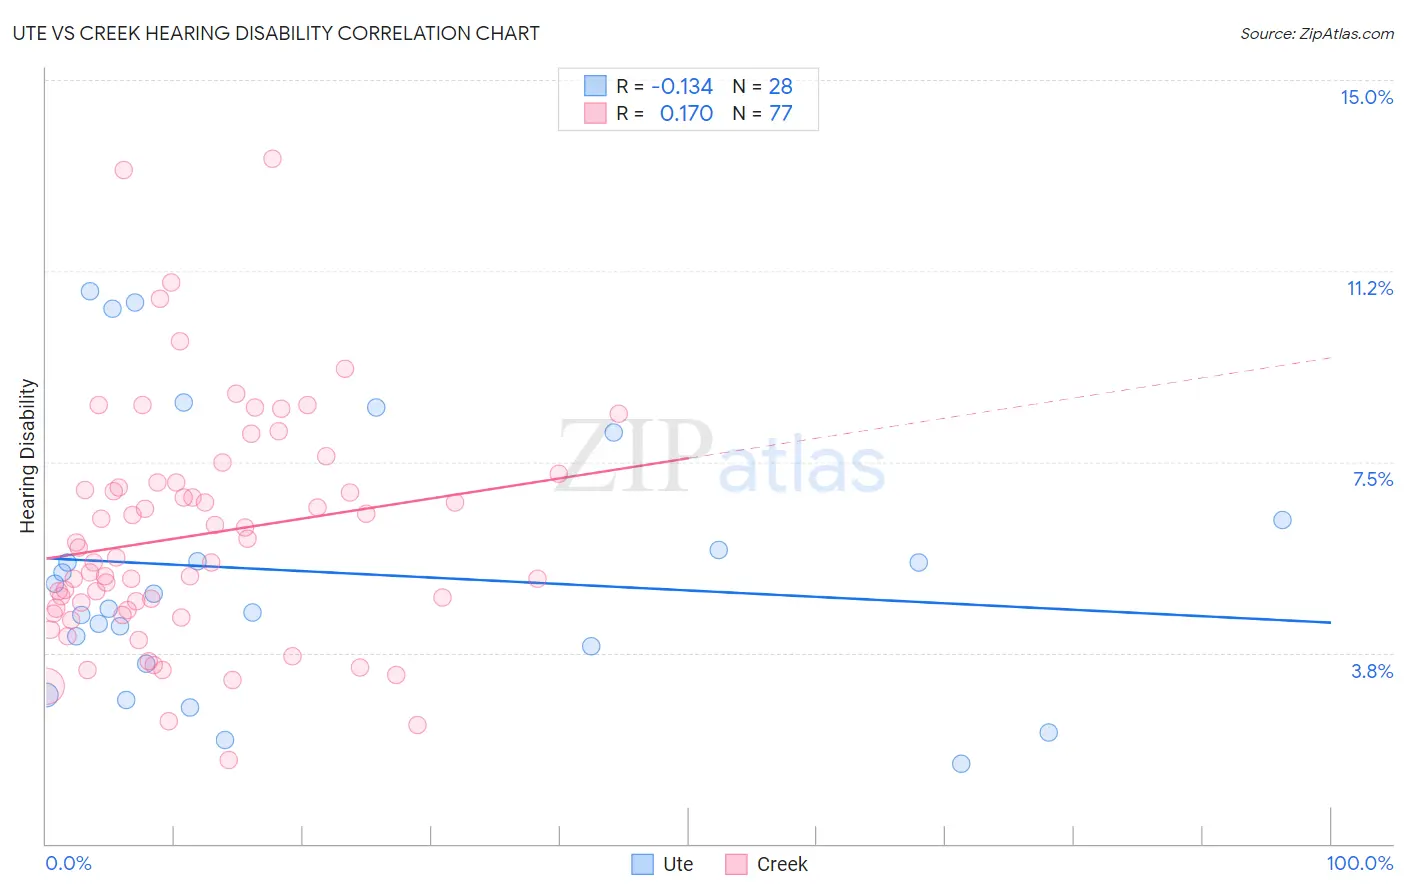
Ute vs Creek Hearing Disability Correlation Chart
The statistical analysis conducted on geographies consisting of 55,656,713 people shows a poor negative correlation between the proportion of Ute and percentage of population with hearing disability in the United States with a correlation coefficient (R) of -0.134 and weighted average of 3.5%. Similarly, the statistical analysis conducted on geographies consisting of 178,433,224 people shows a poor positive correlation between the proportion of Creek and percentage of population with hearing disability in the United States with a correlation coefficient (R) of 0.170 and weighted average of 4.4%, a difference of 24.8%.
Hearing Disability Correlation Summary
| Measurement | Ute | Creek |
| Minimum | 1.6% | 1.6% |
| Maximum | 10.9% | 13.4% |
| Range | 9.3% | 11.8% |
| Mean | 5.3% | 6.1% |
| Median | 4.8% | 5.6% |
| Interquartile 25% (IQ1) | 3.7% | 4.6% |
| Interquartile 75% (IQ3) | 6.1% | 7.1% |
| Interquartile Range (IQR) | 2.3% | 2.5% |
| Standard Deviation (Sample) | 2.6% | 2.3% |
| Standard Deviation (Population) | 2.5% | 2.3% |
Similar Demographics by Hearing Disability
Demographics Similar to Ute by Hearing Disability
In terms of hearing disability, the demographic groups most similar to Ute are Spaniard (3.5%, a difference of 0.30%), Canadian (3.5%, a difference of 0.32%), European (3.5%, a difference of 0.35%), Belgian (3.5%, a difference of 0.54%), and Czech (3.5%, a difference of 0.61%).
| Demographics | Rating | Rank | Hearing Disability |
| Immigrants | North America | 0.1 /100 | #262 | Tragic 3.5% |
| Immigrants | Canada | 0.1 /100 | #263 | Tragic 3.5% |
| Immigrants | Germany | 0.1 /100 | #264 | Tragic 3.5% |
| British | 0.1 /100 | #265 | Tragic 3.5% |
| Belgians | 0.1 /100 | #266 | Tragic 3.5% |
| Canadians | 0.1 /100 | #267 | Tragic 3.5% |
| Spaniards | 0.1 /100 | #268 | Tragic 3.5% |
| Ute | 0.1 /100 | #269 | Tragic 3.5% |
| Europeans | 0.1 /100 | #270 | Tragic 3.5% |
| Czechs | 0.1 /100 | #271 | Tragic 3.5% |
| Fijians | 0.0 /100 | #272 | Tragic 3.5% |
| Puerto Ricans | 0.0 /100 | #273 | Tragic 3.5% |
| Swiss | 0.0 /100 | #274 | Tragic 3.5% |
| Czechoslovakians | 0.0 /100 | #275 | Tragic 3.6% |
| Danes | 0.0 /100 | #276 | Tragic 3.6% |
Demographics Similar to Creek by Hearing Disability
In terms of hearing disability, the demographic groups most similar to Creek are Kiowa (4.3%, a difference of 0.71%), Aleut (4.3%, a difference of 2.0%), Chickasaw (4.5%, a difference of 2.5%), Dutch West Indian (4.3%, a difference of 2.6%), and Alaska Native (4.5%, a difference of 2.7%).
| Demographics | Rating | Rank | Hearing Disability |
| Crow | 0.0 /100 | #329 | Tragic 4.2% |
| Natives/Alaskans | 0.0 /100 | #330 | Tragic 4.2% |
| Cherokee | 0.0 /100 | #331 | Tragic 4.2% |
| Houma | 0.0 /100 | #332 | Tragic 4.2% |
| Dutch West Indians | 0.0 /100 | #333 | Tragic 4.3% |
| Aleuts | 0.0 /100 | #334 | Tragic 4.3% |
| Kiowa | 0.0 /100 | #335 | Tragic 4.3% |
| Creek | 0.0 /100 | #336 | Tragic 4.4% |
| Chickasaw | 0.0 /100 | #337 | Tragic 4.5% |
| Alaska Natives | 0.0 /100 | #338 | Tragic 4.5% |
| Choctaw | 0.0 /100 | #339 | Tragic 4.5% |
| Pueblo | 0.0 /100 | #340 | Tragic 4.6% |
| Navajo | 0.0 /100 | #341 | Tragic 4.6% |
| Tsimshian | 0.0 /100 | #342 | Tragic 4.7% |
| Inupiat | 0.0 /100 | #343 | Tragic 4.7% |