Ute vs Immigrants from Honduras Hearing Disability
COMPARE
Ute
Immigrants from Honduras
Hearing Disability
Hearing Disability Comparison
Ute
Immigrants from Honduras
3.5%
HEARING DISABILITY
0.1/ 100
METRIC RATING
269th/ 347
METRIC RANK
2.8%
HEARING DISABILITY
95.1/ 100
METRIC RATING
98th/ 347
METRIC RANK
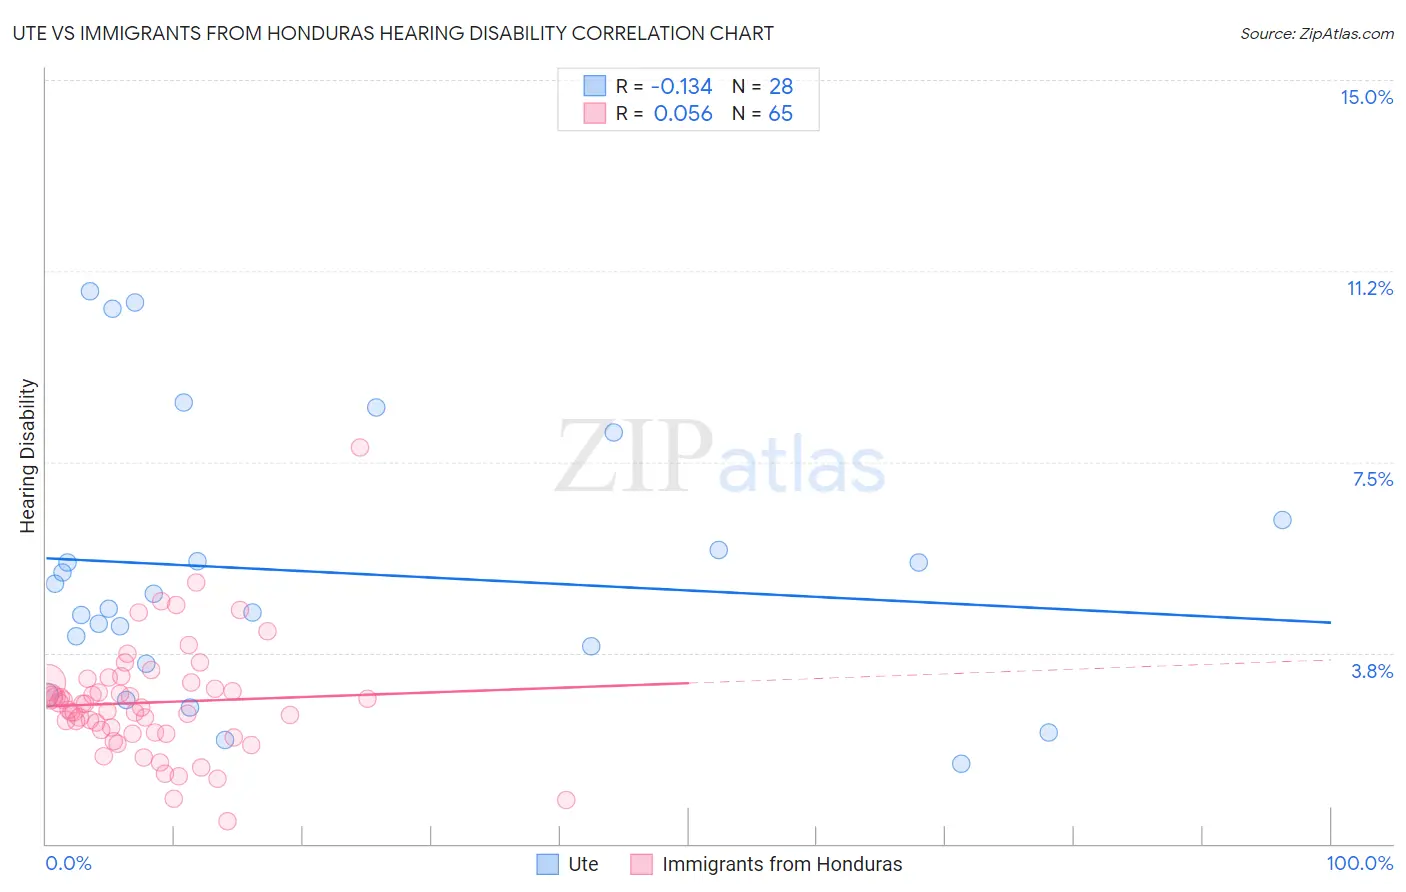
Ute vs Immigrants from Honduras Hearing Disability Correlation Chart
The statistical analysis conducted on geographies consisting of 55,656,713 people shows a poor negative correlation between the proportion of Ute and percentage of population with hearing disability in the United States with a correlation coefficient (R) of -0.134 and weighted average of 3.5%. Similarly, the statistical analysis conducted on geographies consisting of 322,511,420 people shows a slight positive correlation between the proportion of Immigrants from Honduras and percentage of population with hearing disability in the United States with a correlation coefficient (R) of 0.056 and weighted average of 2.8%, a difference of 25.6%.
Hearing Disability Correlation Summary
| Measurement | Ute | Immigrants from Honduras |
| Minimum | 1.6% | 0.44% |
| Maximum | 10.9% | 7.8% |
| Range | 9.3% | 7.3% |
| Mean | 5.3% | 2.8% |
| Median | 4.8% | 2.7% |
| Interquartile 25% (IQ1) | 3.7% | 2.2% |
| Interquartile 75% (IQ3) | 6.1% | 3.2% |
| Interquartile Range (IQR) | 2.3% | 0.98% |
| Standard Deviation (Sample) | 2.6% | 1.1% |
| Standard Deviation (Population) | 2.5% | 1.1% |
Similar Demographics by Hearing Disability
Demographics Similar to Ute by Hearing Disability
In terms of hearing disability, the demographic groups most similar to Ute are Spaniard (3.5%, a difference of 0.30%), Canadian (3.5%, a difference of 0.32%), European (3.5%, a difference of 0.35%), Belgian (3.5%, a difference of 0.54%), and Czech (3.5%, a difference of 0.61%).
| Demographics | Rating | Rank | Hearing Disability |
| Immigrants | North America | 0.1 /100 | #262 | Tragic 3.5% |
| Immigrants | Canada | 0.1 /100 | #263 | Tragic 3.5% |
| Immigrants | Germany | 0.1 /100 | #264 | Tragic 3.5% |
| British | 0.1 /100 | #265 | Tragic 3.5% |
| Belgians | 0.1 /100 | #266 | Tragic 3.5% |
| Canadians | 0.1 /100 | #267 | Tragic 3.5% |
| Spaniards | 0.1 /100 | #268 | Tragic 3.5% |
| Ute | 0.1 /100 | #269 | Tragic 3.5% |
| Europeans | 0.1 /100 | #270 | Tragic 3.5% |
| Czechs | 0.1 /100 | #271 | Tragic 3.5% |
| Fijians | 0.0 /100 | #272 | Tragic 3.5% |
| Puerto Ricans | 0.0 /100 | #273 | Tragic 3.5% |
| Swiss | 0.0 /100 | #274 | Tragic 3.5% |
| Czechoslovakians | 0.0 /100 | #275 | Tragic 3.6% |
| Danes | 0.0 /100 | #276 | Tragic 3.6% |
Demographics Similar to Immigrants from Honduras by Hearing Disability
In terms of hearing disability, the demographic groups most similar to Immigrants from Honduras are Immigrants from Guatemala (2.8%, a difference of 0.040%), Immigrants from Afghanistan (2.8%, a difference of 0.060%), Immigrants from Eastern Africa (2.8%, a difference of 0.090%), Immigrants from Spain (2.8%, a difference of 0.15%), and Taiwanese (2.8%, a difference of 0.16%).
| Demographics | Rating | Rank | Hearing Disability |
| Immigrants | Middle Africa | 96.5 /100 | #91 | Exceptional 2.8% |
| Iranians | 96.4 /100 | #92 | Exceptional 2.8% |
| Immigrants | Kuwait | 96.3 /100 | #93 | Exceptional 2.8% |
| Uruguayans | 95.9 /100 | #94 | Exceptional 2.8% |
| Israelis | 95.9 /100 | #95 | Exceptional 2.8% |
| Immigrants | Somalia | 95.5 /100 | #96 | Exceptional 2.8% |
| Immigrants | Afghanistan | 95.3 /100 | #97 | Exceptional 2.8% |
| Immigrants | Honduras | 95.1 /100 | #98 | Exceptional 2.8% |
| Immigrants | Guatemala | 95.1 /100 | #99 | Exceptional 2.8% |
| Immigrants | Eastern Africa | 95.0 /100 | #100 | Exceptional 2.8% |
| Immigrants | Spain | 94.9 /100 | #101 | Exceptional 2.8% |
| Taiwanese | 94.8 /100 | #102 | Exceptional 2.8% |
| Immigrants | Indonesia | 94.7 /100 | #103 | Exceptional 2.8% |
| Burmese | 94.2 /100 | #104 | Exceptional 2.8% |
| Moroccans | 93.9 /100 | #105 | Exceptional 2.8% |