Ukrainian vs Palestinian Hearing Disability
COMPARE
Ukrainian
Palestinian
Hearing Disability
Hearing Disability Comparison
Ukrainians
Palestinians
3.2%
HEARING DISABILITY
2.9/ 100
METRIC RATING
232nd/ 347
METRIC RANK
2.9%
HEARING DISABILITY
73.6/ 100
METRIC RATING
150th/ 347
METRIC RANK
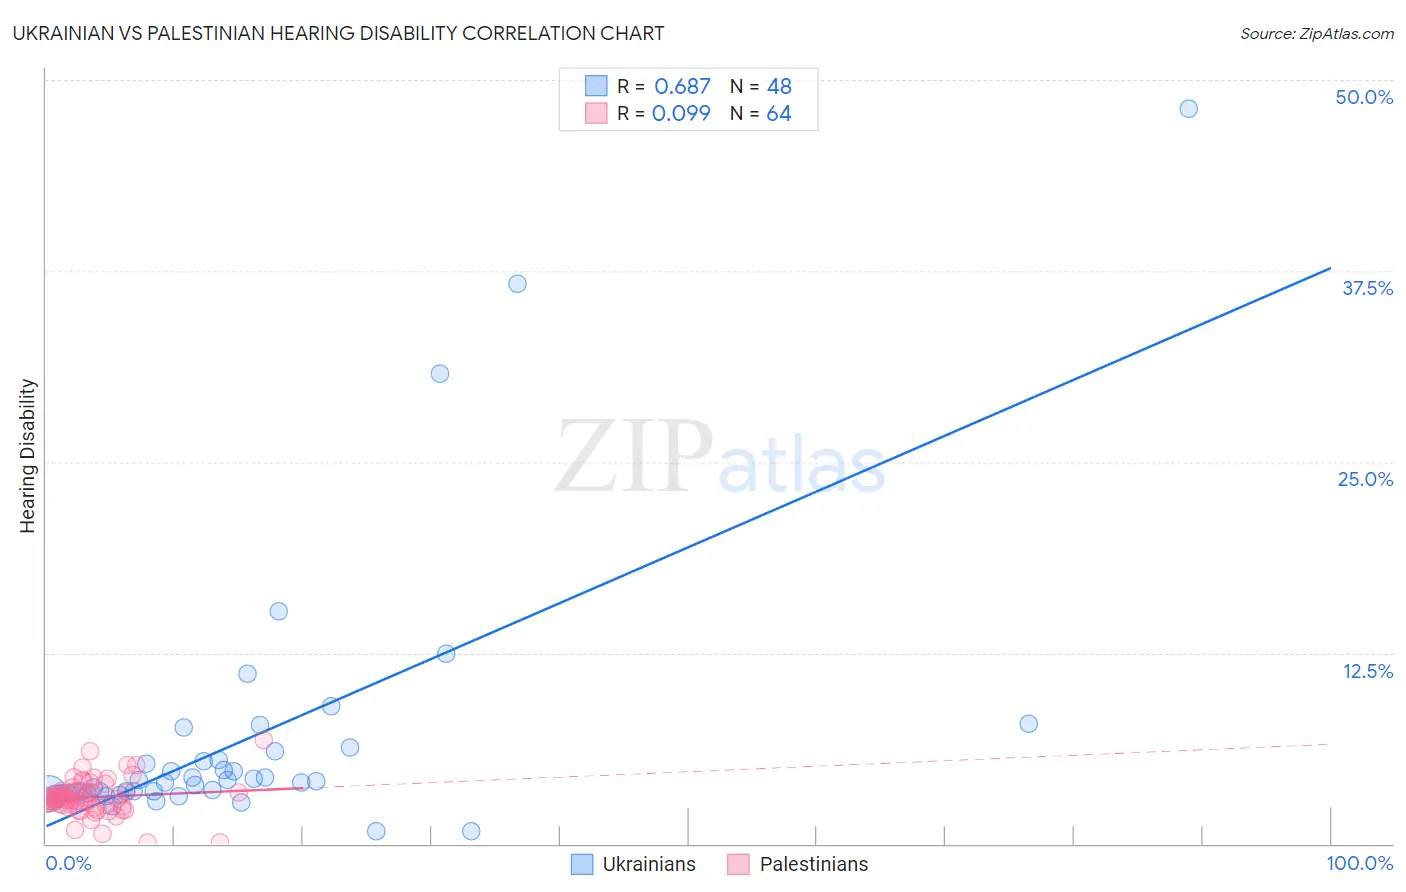
Ukrainian vs Palestinian Hearing Disability Correlation Chart
The statistical analysis conducted on geographies consisting of 448,464,085 people shows a significant positive correlation between the proportion of Ukrainians and percentage of population with hearing disability in the United States with a correlation coefficient (R) of 0.687 and weighted average of 3.2%. Similarly, the statistical analysis conducted on geographies consisting of 216,454,064 people shows a slight positive correlation between the proportion of Palestinians and percentage of population with hearing disability in the United States with a correlation coefficient (R) of 0.099 and weighted average of 2.9%, a difference of 10.9%.
Hearing Disability Correlation Summary
| Measurement | Ukrainian | Palestinian |
| Minimum | 0.79% | 0.070% |
| Maximum | 48.1% | 6.8% |
| Range | 47.4% | 6.7% |
| Mean | 6.9% | 3.0% |
| Median | 4.1% | 2.9% |
| Interquartile 25% (IQ1) | 3.3% | 2.5% |
| Interquartile 75% (IQ3) | 5.8% | 3.4% |
| Interquartile Range (IQR) | 2.5% | 0.93% |
| Standard Deviation (Sample) | 8.9% | 1.2% |
| Standard Deviation (Population) | 8.8% | 1.2% |
Similar Demographics by Hearing Disability
Demographics Similar to Ukrainians by Hearing Disability
In terms of hearing disability, the demographic groups most similar to Ukrainians are Luxembourger (3.2%, a difference of 0.050%), Greek (3.2%, a difference of 0.28%), Estonian (3.3%, a difference of 0.37%), Central American Indian (3.3%, a difference of 0.44%), and Guamanian/Chamorro (3.3%, a difference of 0.55%).
| Demographics | Rating | Rank | Hearing Disability |
| Latvians | 5.1 /100 | #225 | Tragic 3.2% |
| Lebanese | 5.0 /100 | #226 | Tragic 3.2% |
| Bhutanese | 4.6 /100 | #227 | Tragic 3.2% |
| Immigrants | Portugal | 4.3 /100 | #228 | Tragic 3.2% |
| Maltese | 4.1 /100 | #229 | Tragic 3.2% |
| Greeks | 3.2 /100 | #230 | Tragic 3.2% |
| Luxembourgers | 2.9 /100 | #231 | Tragic 3.2% |
| Ukrainians | 2.9 /100 | #232 | Tragic 3.2% |
| Estonians | 2.4 /100 | #233 | Tragic 3.3% |
| Central American Indians | 2.3 /100 | #234 | Tragic 3.3% |
| Guamanians/Chamorros | 2.2 /100 | #235 | Tragic 3.3% |
| Serbians | 2.2 /100 | #236 | Tragic 3.3% |
| Immigrants | Austria | 1.8 /100 | #237 | Tragic 3.3% |
| German Russians | 1.8 /100 | #238 | Tragic 3.3% |
| Nepalese | 1.2 /100 | #239 | Tragic 3.3% |
Demographics Similar to Palestinians by Hearing Disability
In terms of hearing disability, the demographic groups most similar to Palestinians are Immigrants from France (2.9%, a difference of 0.060%), Immigrants from Lithuania (2.9%, a difference of 0.070%), Sudanese (2.9%, a difference of 0.18%), Immigrants from Lebanon (2.9%, a difference of 0.25%), and Costa Rican (2.9%, a difference of 0.27%).
| Demographics | Rating | Rank | Hearing Disability |
| Immigrants | Bahamas | 80.9 /100 | #143 | Excellent 2.9% |
| Immigrants | Bulgaria | 79.2 /100 | #144 | Good 2.9% |
| Immigrants | Congo | 78.9 /100 | #145 | Good 2.9% |
| Brazilians | 78.7 /100 | #146 | Good 2.9% |
| Tongans | 78.6 /100 | #147 | Good 2.9% |
| Immigrants | Russia | 77.7 /100 | #148 | Good 2.9% |
| Immigrants | Panama | 76.9 /100 | #149 | Good 2.9% |
| Palestinians | 73.6 /100 | #150 | Good 2.9% |
| Immigrants | France | 73.1 /100 | #151 | Good 2.9% |
| Immigrants | Lithuania | 73.0 /100 | #152 | Good 2.9% |
| Sudanese | 72.1 /100 | #153 | Good 2.9% |
| Immigrants | Lebanon | 71.5 /100 | #154 | Good 2.9% |
| Costa Ricans | 71.4 /100 | #155 | Good 2.9% |
| Immigrants | Poland | 70.2 /100 | #156 | Good 2.9% |
| Immigrants | Kazakhstan | 69.6 /100 | #157 | Good 2.9% |