Immigrants from Eastern Africa vs Immigrants from Dominican Republic Disability
COMPARE
Immigrants from Eastern Africa
Immigrants from Dominican Republic
Disability
Disability Comparison
Immigrants from Eastern Africa
Immigrants from Dominican Republic
11.3%
DISABILITY
96.7/ 100
METRIC RATING
102nd/ 347
METRIC RANK
12.6%
DISABILITY
0.1/ 100
METRIC RATING
269th/ 347
METRIC RANK
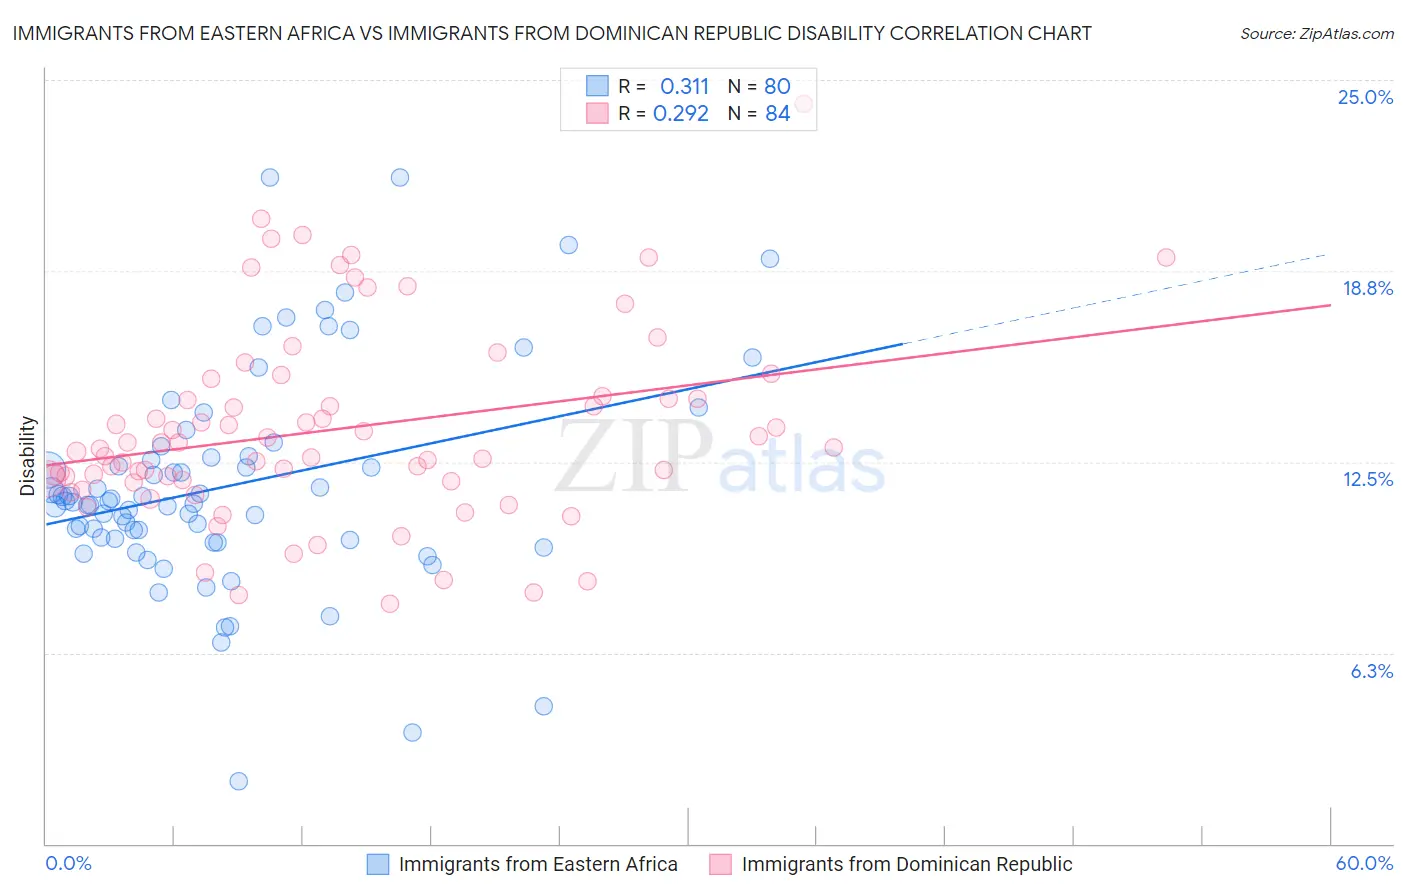
Immigrants from Eastern Africa vs Immigrants from Dominican Republic Disability Correlation Chart
The statistical analysis conducted on geographies consisting of 355,125,072 people shows a mild positive correlation between the proportion of Immigrants from Eastern Africa and percentage of population with a disability in the United States with a correlation coefficient (R) of 0.311 and weighted average of 11.3%. Similarly, the statistical analysis conducted on geographies consisting of 275,091,051 people shows a weak positive correlation between the proportion of Immigrants from Dominican Republic and percentage of population with a disability in the United States with a correlation coefficient (R) of 0.292 and weighted average of 12.6%, a difference of 11.6%.
Disability Correlation Summary
| Measurement | Immigrants from Eastern Africa | Immigrants from Dominican Republic |
| Minimum | 2.1% | 7.9% |
| Maximum | 21.8% | 24.2% |
| Range | 19.7% | 16.4% |
| Mean | 11.7% | 13.6% |
| Median | 11.2% | 12.9% |
| Interquartile 25% (IQ1) | 10.0% | 11.9% |
| Interquartile 75% (IQ3) | 12.7% | 14.6% |
| Interquartile Range (IQR) | 2.7% | 2.7% |
| Standard Deviation (Sample) | 3.5% | 3.2% |
| Standard Deviation (Population) | 3.5% | 3.1% |
Similar Demographics by Disability
Demographics Similar to Immigrants from Eastern Africa by Disability
In terms of disability, the demographic groups most similar to Immigrants from Eastern Africa are Immigrants from Nicaragua (11.3%, a difference of 0.060%), Immigrants from Uruguay (11.3%, a difference of 0.070%), Immigrants (11.3%, a difference of 0.080%), Immigrants from Kazakhstan (11.3%, a difference of 0.090%), and Immigrants from Greece (11.3%, a difference of 0.11%).
| Demographics | Rating | Rank | Disability |
| Eastern Europeans | 97.8 /100 | #95 | Exceptional 11.2% |
| Immigrants | Zimbabwe | 97.7 /100 | #96 | Exceptional 11.2% |
| Bhutanese | 97.4 /100 | #97 | Exceptional 11.2% |
| Uruguayans | 97.4 /100 | #98 | Exceptional 11.2% |
| Immigrants | Czechoslovakia | 97.4 /100 | #99 | Exceptional 11.2% |
| Immigrants | Greece | 96.9 /100 | #100 | Exceptional 11.3% |
| Immigrants | Nicaragua | 96.8 /100 | #101 | Exceptional 11.3% |
| Immigrants | Eastern Africa | 96.7 /100 | #102 | Exceptional 11.3% |
| Immigrants | Uruguay | 96.4 /100 | #103 | Exceptional 11.3% |
| Immigrants | Immigrants | 96.4 /100 | #104 | Exceptional 11.3% |
| Immigrants | Kazakhstan | 96.4 /100 | #105 | Exceptional 11.3% |
| Immigrants | Eastern Europe | 96.3 /100 | #106 | Exceptional 11.3% |
| Nicaraguans | 96.2 /100 | #107 | Exceptional 11.3% |
| Immigrants | Nigeria | 96.0 /100 | #108 | Exceptional 11.3% |
| Immigrants | Uganda | 95.7 /100 | #109 | Exceptional 11.3% |
Demographics Similar to Immigrants from Dominican Republic by Disability
In terms of disability, the demographic groups most similar to Immigrants from Dominican Republic are Bangladeshi (12.6%, a difference of 0.090%), Portuguese (12.6%, a difference of 0.39%), Spaniard (12.5%, a difference of 0.42%), Immigrants from Yemen (12.6%, a difference of 0.44%), and Czechoslovakian (12.5%, a difference of 0.49%).
| Demographics | Rating | Rank | Disability |
| Native Hawaiians | 0.3 /100 | #262 | Tragic 12.5% |
| Hawaiians | 0.2 /100 | #263 | Tragic 12.5% |
| Immigrants | Germany | 0.2 /100 | #264 | Tragic 12.5% |
| U.S. Virgin Islanders | 0.2 /100 | #265 | Tragic 12.5% |
| Czechoslovakians | 0.2 /100 | #266 | Tragic 12.5% |
| Spaniards | 0.2 /100 | #267 | Tragic 12.5% |
| Bangladeshis | 0.1 /100 | #268 | Tragic 12.6% |
| Immigrants | Dominican Republic | 0.1 /100 | #269 | Tragic 12.6% |
| Portuguese | 0.1 /100 | #270 | Tragic 12.6% |
| Immigrants | Yemen | 0.1 /100 | #271 | Tragic 12.6% |
| Dominicans | 0.0 /100 | #272 | Tragic 12.7% |
| Finns | 0.0 /100 | #273 | Tragic 12.7% |
| Nepalese | 0.0 /100 | #274 | Tragic 12.8% |
| Sioux | 0.0 /100 | #275 | Tragic 12.8% |
| Hmong | 0.0 /100 | #276 | Tragic 12.8% |