Iroquois vs Immigrants from Dominican Republic Disability
COMPARE
Iroquois
Immigrants from Dominican Republic
Disability
Disability Comparison
Iroquois
Immigrants from Dominican Republic
13.8%
DISABILITY
0.0/ 100
METRIC RATING
319th/ 347
METRIC RANK
12.6%
DISABILITY
0.1/ 100
METRIC RATING
269th/ 347
METRIC RANK
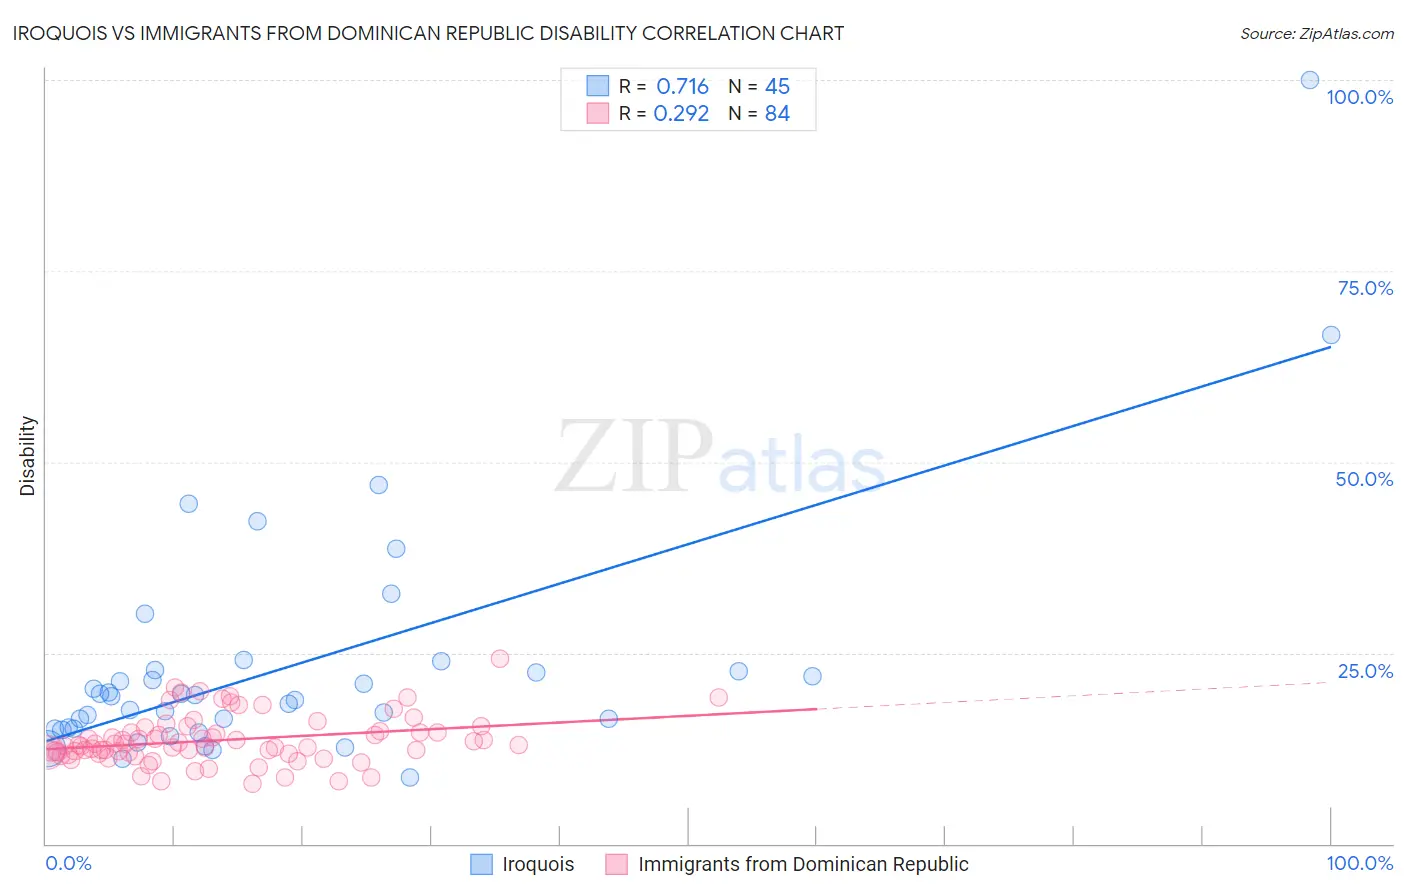
Iroquois vs Immigrants from Dominican Republic Disability Correlation Chart
The statistical analysis conducted on geographies consisting of 207,277,318 people shows a strong positive correlation between the proportion of Iroquois and percentage of population with a disability in the United States with a correlation coefficient (R) of 0.716 and weighted average of 13.8%. Similarly, the statistical analysis conducted on geographies consisting of 275,091,051 people shows a weak positive correlation between the proportion of Immigrants from Dominican Republic and percentage of population with a disability in the United States with a correlation coefficient (R) of 0.292 and weighted average of 12.6%, a difference of 9.9%.
Disability Correlation Summary
| Measurement | Iroquois | Immigrants from Dominican Republic |
| Minimum | 8.7% | 7.9% |
| Maximum | 100.0% | 24.2% |
| Range | 91.3% | 16.4% |
| Mean | 23.3% | 13.6% |
| Median | 19.3% | 12.9% |
| Interquartile 25% (IQ1) | 15.0% | 11.9% |
| Interquartile 75% (IQ3) | 22.7% | 14.6% |
| Interquartile Range (IQR) | 7.7% | 2.7% |
| Standard Deviation (Sample) | 16.0% | 3.2% |
| Standard Deviation (Population) | 15.8% | 3.1% |
Similar Demographics by Disability
Demographics Similar to Iroquois by Disability
In terms of disability, the demographic groups most similar to Iroquois are Menominee (13.8%, a difference of 0.21%), Apache (13.9%, a difference of 0.29%), Paiute (13.9%, a difference of 0.42%), Pima (13.7%, a difference of 0.79%), and Immigrants from Cabo Verde (13.7%, a difference of 0.79%).
| Demographics | Rating | Rank | Disability |
| Spanish Americans | 0.0 /100 | #312 | Tragic 13.6% |
| Cree | 0.0 /100 | #313 | Tragic 13.7% |
| Blacks/African Americans | 0.0 /100 | #314 | Tragic 13.7% |
| Puget Sound Salish | 0.0 /100 | #315 | Tragic 13.7% |
| Pima | 0.0 /100 | #316 | Tragic 13.7% |
| Immigrants | Cabo Verde | 0.0 /100 | #317 | Tragic 13.7% |
| Menominee | 0.0 /100 | #318 | Tragic 13.8% |
| Iroquois | 0.0 /100 | #319 | Tragic 13.8% |
| Apache | 0.0 /100 | #320 | Tragic 13.9% |
| Paiute | 0.0 /100 | #321 | Tragic 13.9% |
| Americans | 0.0 /100 | #322 | Tragic 13.9% |
| Comanche | 0.0 /100 | #323 | Tragic 14.1% |
| Chippewa | 0.0 /100 | #324 | Tragic 14.1% |
| Natives/Alaskans | 0.0 /100 | #325 | Tragic 14.2% |
| Osage | 0.0 /100 | #326 | Tragic 14.2% |
Demographics Similar to Immigrants from Dominican Republic by Disability
In terms of disability, the demographic groups most similar to Immigrants from Dominican Republic are Bangladeshi (12.6%, a difference of 0.090%), Portuguese (12.6%, a difference of 0.39%), Spaniard (12.5%, a difference of 0.42%), Immigrants from Yemen (12.6%, a difference of 0.44%), and Czechoslovakian (12.5%, a difference of 0.49%).
| Demographics | Rating | Rank | Disability |
| Native Hawaiians | 0.3 /100 | #262 | Tragic 12.5% |
| Hawaiians | 0.2 /100 | #263 | Tragic 12.5% |
| Immigrants | Germany | 0.2 /100 | #264 | Tragic 12.5% |
| U.S. Virgin Islanders | 0.2 /100 | #265 | Tragic 12.5% |
| Czechoslovakians | 0.2 /100 | #266 | Tragic 12.5% |
| Spaniards | 0.2 /100 | #267 | Tragic 12.5% |
| Bangladeshis | 0.1 /100 | #268 | Tragic 12.6% |
| Immigrants | Dominican Republic | 0.1 /100 | #269 | Tragic 12.6% |
| Portuguese | 0.1 /100 | #270 | Tragic 12.6% |
| Immigrants | Yemen | 0.1 /100 | #271 | Tragic 12.6% |
| Dominicans | 0.0 /100 | #272 | Tragic 12.7% |
| Finns | 0.0 /100 | #273 | Tragic 12.7% |
| Nepalese | 0.0 /100 | #274 | Tragic 12.8% |
| Sioux | 0.0 /100 | #275 | Tragic 12.8% |
| Hmong | 0.0 /100 | #276 | Tragic 12.8% |