Arapaho vs Immigrants from Dominican Republic Disability
COMPARE
Arapaho
Immigrants from Dominican Republic
Disability
Disability Comparison
Arapaho
Immigrants from Dominican Republic
13.2%
DISABILITY
0.0/ 100
METRIC RATING
302nd/ 347
METRIC RANK
12.6%
DISABILITY
0.1/ 100
METRIC RATING
269th/ 347
METRIC RANK
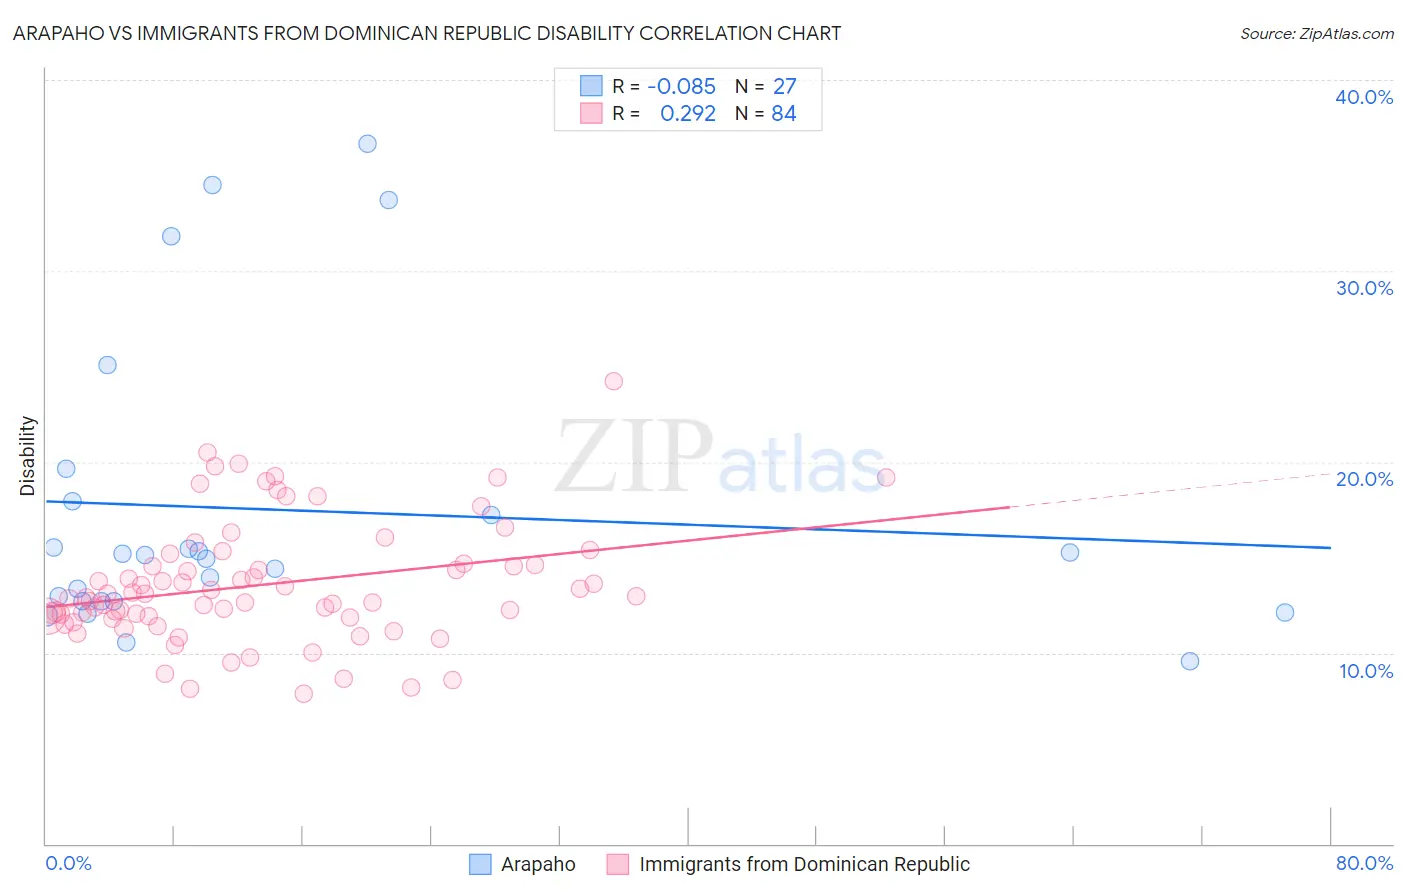
Arapaho vs Immigrants from Dominican Republic Disability Correlation Chart
The statistical analysis conducted on geographies consisting of 29,780,325 people shows a slight negative correlation between the proportion of Arapaho and percentage of population with a disability in the United States with a correlation coefficient (R) of -0.085 and weighted average of 13.2%. Similarly, the statistical analysis conducted on geographies consisting of 275,091,051 people shows a weak positive correlation between the proportion of Immigrants from Dominican Republic and percentage of population with a disability in the United States with a correlation coefficient (R) of 0.292 and weighted average of 12.6%, a difference of 5.1%.
Disability Correlation Summary
| Measurement | Arapaho | Immigrants from Dominican Republic |
| Minimum | 9.5% | 7.9% |
| Maximum | 36.7% | 24.2% |
| Range | 27.1% | 16.4% |
| Mean | 17.5% | 13.6% |
| Median | 15.1% | 12.9% |
| Interquartile 25% (IQ1) | 12.7% | 11.9% |
| Interquartile 75% (IQ3) | 17.9% | 14.6% |
| Interquartile Range (IQR) | 5.2% | 2.7% |
| Standard Deviation (Sample) | 7.7% | 3.2% |
| Standard Deviation (Population) | 7.6% | 3.1% |
Similar Demographics by Disability
Demographics Similar to Arapaho by Disability
In terms of disability, the demographic groups most similar to Arapaho are Immigrants from Micronesia (13.2%, a difference of 0.21%), Pennsylvania German (13.2%, a difference of 0.29%), French (13.2%, a difference of 0.34%), Alaska Native (13.2%, a difference of 0.36%), and Hopi (13.2%, a difference of 0.37%).
| Demographics | Rating | Rank | Disability |
| Immigrants | Nonimmigrants | 0.0 /100 | #295 | Tragic 13.2% |
| Central American Indians | 0.0 /100 | #296 | Tragic 13.2% |
| Hopi | 0.0 /100 | #297 | Tragic 13.2% |
| Alaska Natives | 0.0 /100 | #298 | Tragic 13.2% |
| French | 0.0 /100 | #299 | Tragic 13.2% |
| Pennsylvania Germans | 0.0 /100 | #300 | Tragic 13.2% |
| Immigrants | Micronesia | 0.0 /100 | #301 | Tragic 13.2% |
| Arapaho | 0.0 /100 | #302 | Tragic 13.2% |
| Scotch-Irish | 0.0 /100 | #303 | Tragic 13.3% |
| Yakama | 0.0 /100 | #304 | Tragic 13.4% |
| French Canadians | 0.0 /100 | #305 | Tragic 13.4% |
| Cape Verdeans | 0.0 /100 | #306 | Tragic 13.5% |
| Shoshone | 0.0 /100 | #307 | Tragic 13.5% |
| French American Indians | 0.0 /100 | #308 | Tragic 13.5% |
| Tlingit-Haida | 0.0 /100 | #309 | Tragic 13.5% |
Demographics Similar to Immigrants from Dominican Republic by Disability
In terms of disability, the demographic groups most similar to Immigrants from Dominican Republic are Bangladeshi (12.6%, a difference of 0.090%), Portuguese (12.6%, a difference of 0.39%), Spaniard (12.5%, a difference of 0.42%), Immigrants from Yemen (12.6%, a difference of 0.44%), and Czechoslovakian (12.5%, a difference of 0.49%).
| Demographics | Rating | Rank | Disability |
| Native Hawaiians | 0.3 /100 | #262 | Tragic 12.5% |
| Hawaiians | 0.2 /100 | #263 | Tragic 12.5% |
| Immigrants | Germany | 0.2 /100 | #264 | Tragic 12.5% |
| U.S. Virgin Islanders | 0.2 /100 | #265 | Tragic 12.5% |
| Czechoslovakians | 0.2 /100 | #266 | Tragic 12.5% |
| Spaniards | 0.2 /100 | #267 | Tragic 12.5% |
| Bangladeshis | 0.1 /100 | #268 | Tragic 12.6% |
| Immigrants | Dominican Republic | 0.1 /100 | #269 | Tragic 12.6% |
| Portuguese | 0.1 /100 | #270 | Tragic 12.6% |
| Immigrants | Yemen | 0.1 /100 | #271 | Tragic 12.6% |
| Dominicans | 0.0 /100 | #272 | Tragic 12.7% |
| Finns | 0.0 /100 | #273 | Tragic 12.7% |
| Nepalese | 0.0 /100 | #274 | Tragic 12.8% |
| Sioux | 0.0 /100 | #275 | Tragic 12.8% |
| Hmong | 0.0 /100 | #276 | Tragic 12.8% |