Immigrants from Serbia vs African Hearing Disability
COMPARE
Immigrants from Serbia
African
Hearing Disability
Hearing Disability Comparison
Immigrants from Serbia
Africans
3.0%
HEARING DISABILITY
51.1/ 100
METRIC RATING
173rd/ 347
METRIC RANK
3.0%
HEARING DISABILITY
32.9/ 100
METRIC RATING
189th/ 347
METRIC RANK
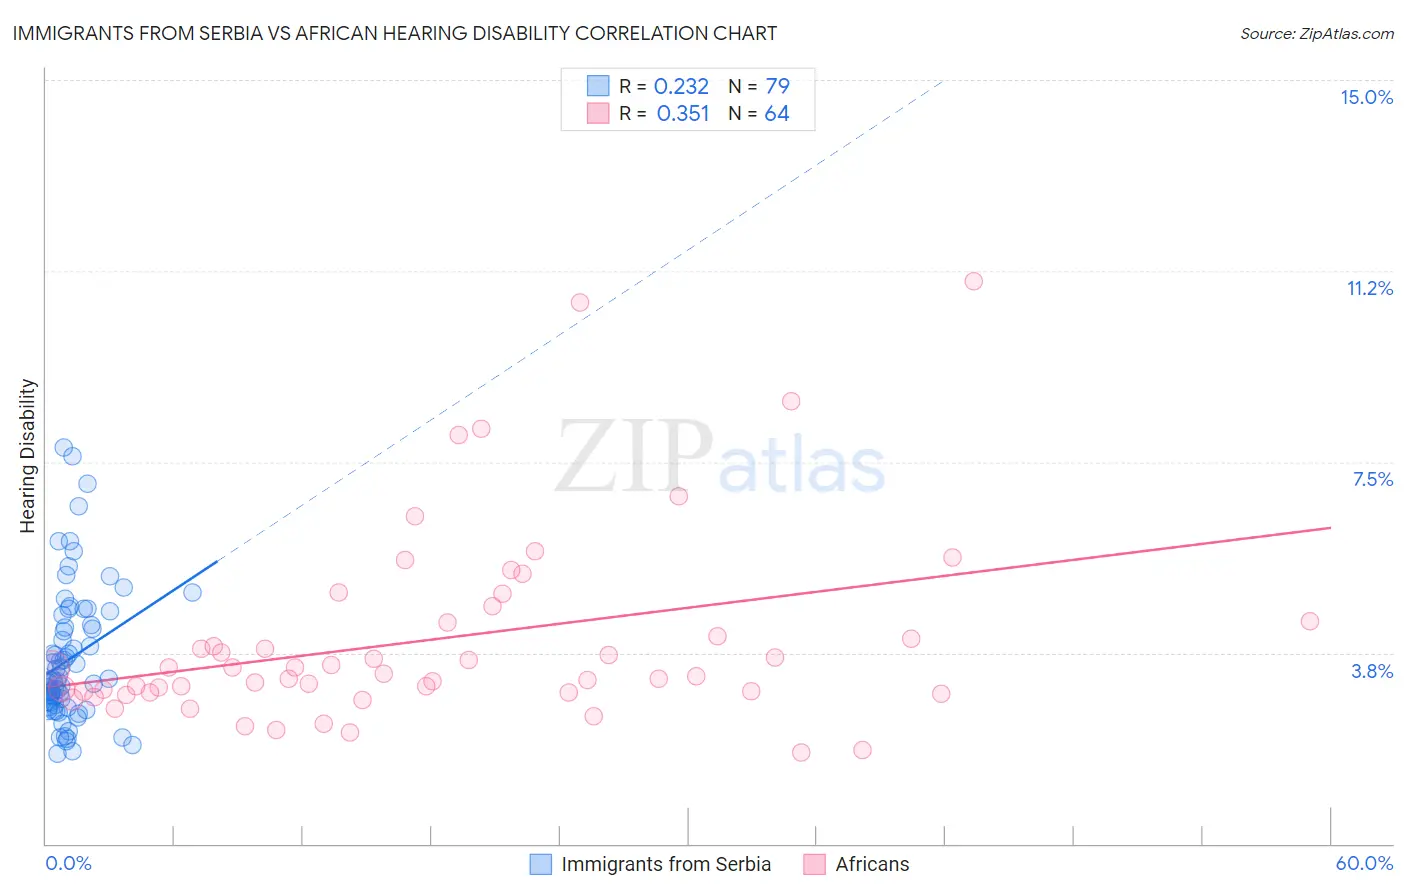
Immigrants from Serbia vs African Hearing Disability Correlation Chart
The statistical analysis conducted on geographies consisting of 131,744,668 people shows a weak positive correlation between the proportion of Immigrants from Serbia and percentage of population with hearing disability in the United States with a correlation coefficient (R) of 0.232 and weighted average of 3.0%. Similarly, the statistical analysis conducted on geographies consisting of 469,733,776 people shows a mild positive correlation between the proportion of Africans and percentage of population with hearing disability in the United States with a correlation coefficient (R) of 0.351 and weighted average of 3.0%, a difference of 1.8%.
Hearing Disability Correlation Summary
| Measurement | Immigrants from Serbia | African |
| Minimum | 1.8% | 1.8% |
| Maximum | 7.8% | 11.1% |
| Range | 6.0% | 9.3% |
| Mean | 3.6% | 4.0% |
| Median | 3.2% | 3.4% |
| Interquartile 25% (IQ1) | 2.7% | 3.0% |
| Interquartile 75% (IQ3) | 4.3% | 4.4% |
| Interquartile Range (IQR) | 1.6% | 1.4% |
| Standard Deviation (Sample) | 1.3% | 1.9% |
| Standard Deviation (Population) | 1.3% | 1.9% |
Demographics Similar to Immigrants from Serbia and Africans by Hearing Disability
In terms of hearing disability, the demographic groups most similar to Immigrants from Serbia are Indonesian (3.0%, a difference of 0.10%), Immigrants from Romania (3.0%, a difference of 0.25%), Panamanian (3.0%, a difference of 0.38%), Immigrants from Philippines (3.0%, a difference of 0.44%), and Armenian (3.0%, a difference of 0.47%). Similarly, the demographic groups most similar to Africans are Black/African American (3.0%, a difference of 0.19%), Mexican American Indian (3.0%, a difference of 0.19%), Immigrants from South Africa (3.1%, a difference of 0.19%), Immigrants from Mexico (3.0%, a difference of 0.21%), and Immigrants from Southern Europe (3.0%, a difference of 0.25%).
| Demographics | Rating | Rank | Hearing Disability |
| Immigrants | Ukraine | 56.6 /100 | #171 | Average 3.0% |
| Armenians | 56.0 /100 | #172 | Average 3.0% |
| Immigrants | Serbia | 51.1 /100 | #173 | Average 3.0% |
| Indonesians | 50.0 /100 | #174 | Average 3.0% |
| Immigrants | Romania | 48.4 /100 | #175 | Average 3.0% |
| Panamanians | 47.0 /100 | #176 | Average 3.0% |
| Immigrants | Philippines | 46.4 /100 | #177 | Average 3.0% |
| Japanese | 46.0 /100 | #178 | Average 3.0% |
| Immigrants | Moldova | 43.1 /100 | #179 | Average 3.0% |
| Immigrants | Sweden | 42.4 /100 | #180 | Average 3.0% |
| Immigrants | Belgium | 41.5 /100 | #181 | Average 3.0% |
| Immigrants | Italy | 41.1 /100 | #182 | Average 3.0% |
| Bulgarians | 39.7 /100 | #183 | Fair 3.0% |
| Immigrants | Ireland | 37.4 /100 | #184 | Fair 3.0% |
| Immigrants | Southern Europe | 35.3 /100 | #185 | Fair 3.0% |
| Immigrants | Mexico | 34.9 /100 | #186 | Fair 3.0% |
| Blacks/African Americans | 34.7 /100 | #187 | Fair 3.0% |
| Mexican American Indians | 34.7 /100 | #188 | Fair 3.0% |
| Africans | 32.9 /100 | #189 | Fair 3.0% |
| Immigrants | South Africa | 31.1 /100 | #190 | Fair 3.1% |
| Immigrants | Switzerland | 28.8 /100 | #191 | Fair 3.1% |