Uruguayan vs Bermudan In Labor Force | Age 20-24
COMPARE
Uruguayan
Bermudan
In Labor Force | Age 20-24
In Labor Force | Age 20-24 Comparison
Uruguayans
Bermudans
74.6%
IN LABOR FORCE | AGE 20-24
15.1/ 100
METRIC RATING
210th/ 347
METRIC RANK
74.1%
IN LABOR FORCE | AGE 20-24
3.2/ 100
METRIC RATING
237th/ 347
METRIC RANK
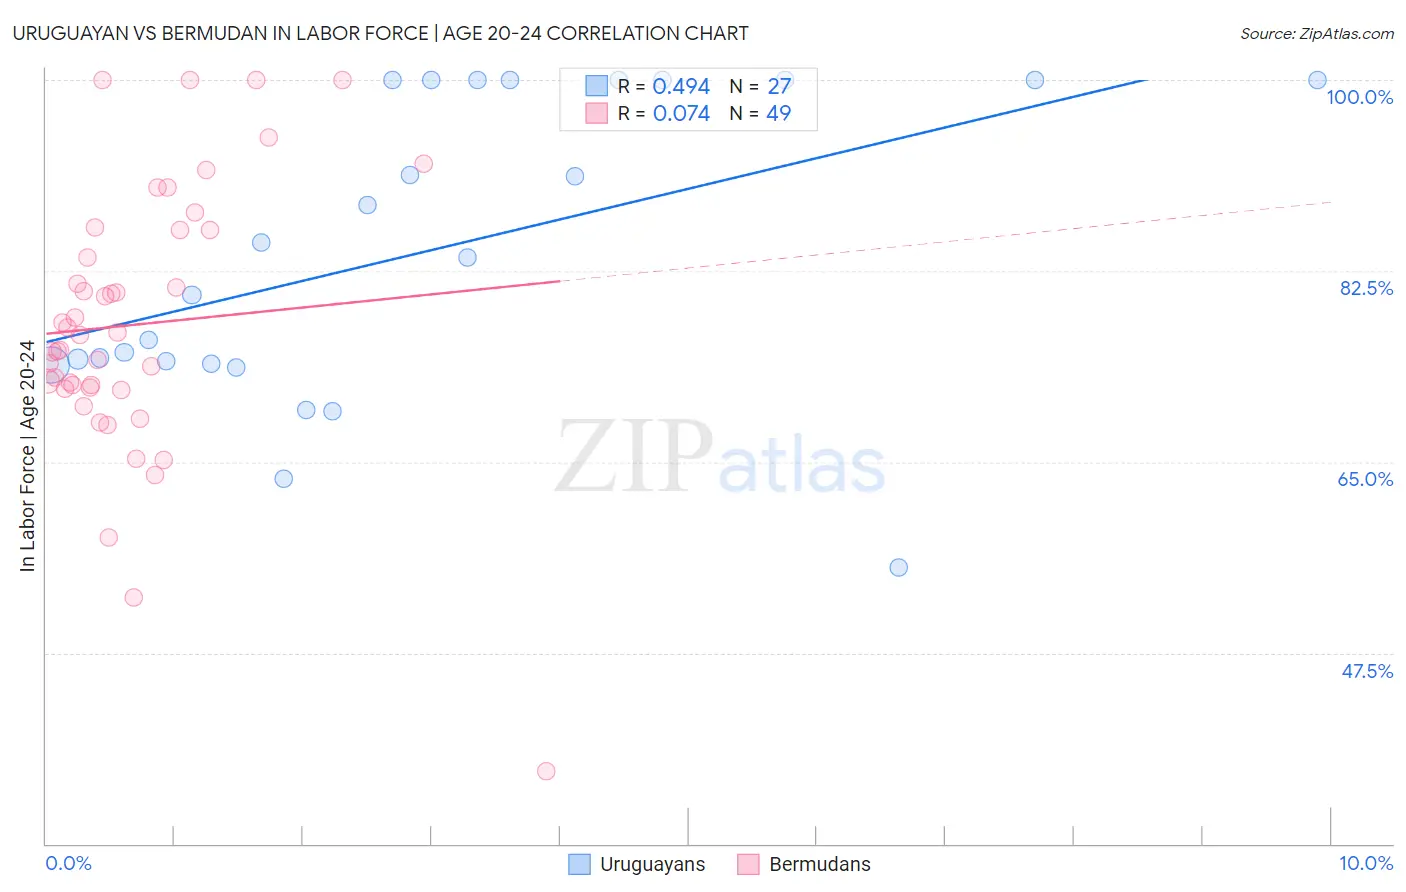
Uruguayan vs Bermudan In Labor Force | Age 20-24 Correlation Chart
The statistical analysis conducted on geographies consisting of 144,780,215 people shows a moderate positive correlation between the proportion of Uruguayans and labor force participation rate among population between the ages 20 and 24 in the United States with a correlation coefficient (R) of 0.494 and weighted average of 74.6%. Similarly, the statistical analysis conducted on geographies consisting of 55,728,431 people shows a slight positive correlation between the proportion of Bermudans and labor force participation rate among population between the ages 20 and 24 in the United States with a correlation coefficient (R) of 0.074 and weighted average of 74.1%, a difference of 0.62%.
In Labor Force | Age 20-24 Correlation Summary
| Measurement | Uruguayan | Bermudan |
| Minimum | 55.3% | 36.7% |
| Maximum | 100.0% | 100.0% |
| Range | 44.7% | 63.3% |
| Mean | 84.2% | 77.6% |
| Median | 83.7% | 76.7% |
| Interquartile 25% (IQ1) | 74.0% | 71.8% |
| Interquartile 75% (IQ3) | 100.0% | 86.2% |
| Interquartile Range (IQR) | 26.0% | 14.4% |
| Standard Deviation (Sample) | 13.6% | 12.3% |
| Standard Deviation (Population) | 13.4% | 12.1% |
Similar Demographics by In Labor Force | Age 20-24
Demographics Similar to Uruguayans by In Labor Force | Age 20-24
In terms of in labor force | age 20-24, the demographic groups most similar to Uruguayans are Immigrants from Australia (74.6%, a difference of 0.010%), Immigrants from Uruguay (74.6%, a difference of 0.020%), Arab (74.6%, a difference of 0.020%), Albanian (74.6%, a difference of 0.030%), and Creek (74.5%, a difference of 0.050%).
| Demographics | Rating | Rank | In Labor Force | Age 20-24 |
| Immigrants | Northern Africa | 17.9 /100 | #203 | Poor 74.6% |
| Immigrants | Italy | 17.6 /100 | #204 | Poor 74.6% |
| Inupiat | 17.6 /100 | #205 | Poor 74.6% |
| Sioux | 17.5 /100 | #206 | Poor 74.6% |
| Albanians | 16.2 /100 | #207 | Poor 74.6% |
| Immigrants | Uruguay | 15.8 /100 | #208 | Poor 74.6% |
| Arabs | 15.8 /100 | #209 | Poor 74.6% |
| Uruguayans | 15.1 /100 | #210 | Poor 74.6% |
| Immigrants | Australia | 14.7 /100 | #211 | Poor 74.6% |
| Creek | 13.3 /100 | #212 | Poor 74.5% |
| Peruvians | 13.3 /100 | #213 | Poor 74.5% |
| Immigrants | Southern Europe | 13.2 /100 | #214 | Poor 74.5% |
| Immigrants | Ghana | 12.7 /100 | #215 | Poor 74.5% |
| Immigrants | Kuwait | 12.7 /100 | #216 | Poor 74.5% |
| Chileans | 12.5 /100 | #217 | Poor 74.5% |
Demographics Similar to Bermudans by In Labor Force | Age 20-24
In terms of in labor force | age 20-24, the demographic groups most similar to Bermudans are Immigrants from France (74.1%, a difference of 0.010%), Laotian (74.1%, a difference of 0.030%), Immigrants from Japan (74.1%, a difference of 0.030%), Immigrants (74.1%, a difference of 0.040%), and Immigrants from Chile (74.1%, a difference of 0.050%).
| Demographics | Rating | Rank | In Labor Force | Age 20-24 |
| Immigrants | Albania | 4.3 /100 | #230 | Tragic 74.2% |
| Immigrants | Greece | 4.1 /100 | #231 | Tragic 74.2% |
| Immigrants | Switzerland | 4.1 /100 | #232 | Tragic 74.2% |
| Immigrants | Chile | 3.7 /100 | #233 | Tragic 74.1% |
| Immigrants | Immigrants | 3.6 /100 | #234 | Tragic 74.1% |
| Laotians | 3.5 /100 | #235 | Tragic 74.1% |
| Immigrants | France | 3.3 /100 | #236 | Tragic 74.1% |
| Bermudans | 3.2 /100 | #237 | Tragic 74.1% |
| Immigrants | Japan | 3.0 /100 | #238 | Tragic 74.1% |
| Immigrants | Latin America | 2.7 /100 | #239 | Tragic 74.1% |
| Immigrants | Sri Lanka | 2.3 /100 | #240 | Tragic 74.0% |
| Immigrants | Senegal | 2.1 /100 | #241 | Tragic 74.0% |
| Thais | 2.1 /100 | #242 | Tragic 74.0% |
| Immigrants | Syria | 1.9 /100 | #243 | Tragic 74.0% |
| Immigrants | South Central Asia | 1.9 /100 | #244 | Tragic 74.0% |