Uruguayan vs Bermudan 1 or more Vehicles in Household
COMPARE
Uruguayan
Bermudan
1 or more Vehicles in Household
1 or more Vehicles in Household Comparison
Uruguayans
Bermudans
88.8%
1 OR MORE VEHICLES IN HOUSEHOLD
7.0/ 100
METRIC RATING
222nd/ 347
METRIC RANK
87.5%
1 OR MORE VEHICLES IN HOUSEHOLD
0.2/ 100
METRIC RATING
271st/ 347
METRIC RANK
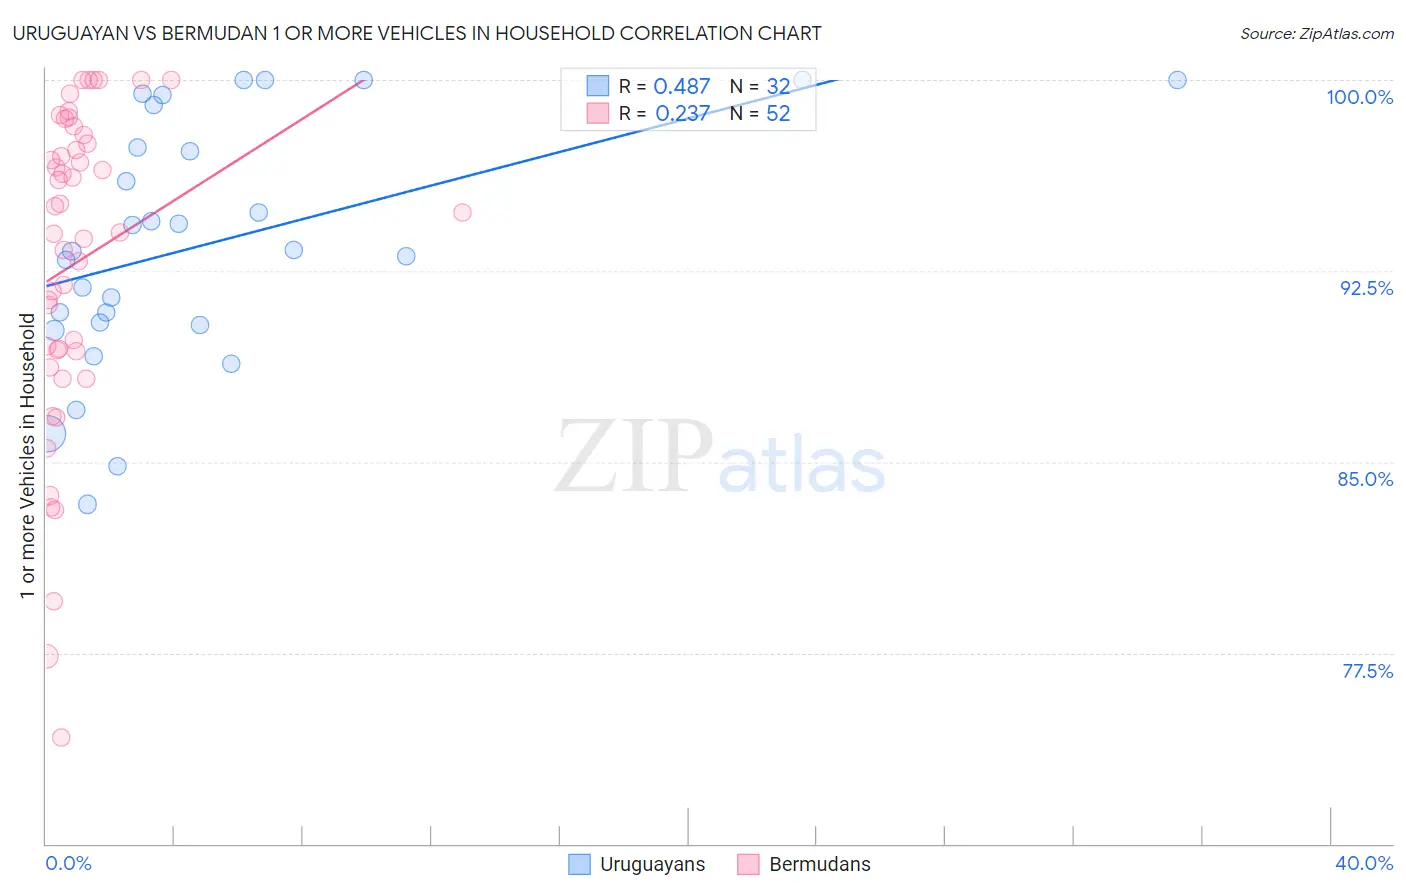
Uruguayan vs Bermudan 1 or more Vehicles in Household Correlation Chart
The statistical analysis conducted on geographies consisting of 144,759,773 people shows a moderate positive correlation between the proportion of Uruguayans and percentage of households with 1 or more vehicles available in the United States with a correlation coefficient (R) of 0.487 and weighted average of 88.8%. Similarly, the statistical analysis conducted on geographies consisting of 55,645,042 people shows a weak positive correlation between the proportion of Bermudans and percentage of households with 1 or more vehicles available in the United States with a correlation coefficient (R) of 0.237 and weighted average of 87.5%, a difference of 1.4%.
1 or more Vehicles in Household Correlation Summary
| Measurement | Uruguayan | Bermudan |
| Minimum | 83.3% | 74.2% |
| Maximum | 100.0% | 100.0% |
| Range | 16.7% | 25.8% |
| Mean | 93.6% | 92.9% |
| Median | 93.3% | 94.4% |
| Interquartile 25% (IQ1) | 90.4% | 89.4% |
| Interquartile 75% (IQ3) | 98.2% | 97.7% |
| Interquartile Range (IQR) | 7.7% | 8.3% |
| Standard Deviation (Sample) | 4.8% | 6.2% |
| Standard Deviation (Population) | 4.7% | 6.2% |
Similar Demographics by 1 or more Vehicles in Household
Demographics Similar to Uruguayans by 1 or more Vehicles in Household
In terms of 1 or more vehicles in household, the demographic groups most similar to Uruguayans are Immigrants from South America (88.8%, a difference of 0.0%), Peruvian (88.8%, a difference of 0.050%), Immigrants from Hong Kong (88.7%, a difference of 0.050%), Cree (88.7%, a difference of 0.060%), and Immigrants from Zaire (88.8%, a difference of 0.070%).
| Demographics | Rating | Rank | 1 or more Vehicles in Household |
| Immigrants | Sri Lanka | 10.2 /100 | #215 | Poor 88.9% |
| Immigrants | Argentina | 9.4 /100 | #216 | Tragic 88.9% |
| Argentineans | 8.8 /100 | #217 | Tragic 88.9% |
| Ugandans | 8.7 /100 | #218 | Tragic 88.9% |
| Immigrants | Guatemala | 8.6 /100 | #219 | Tragic 88.9% |
| Immigrants | Zaire | 8.1 /100 | #220 | Tragic 88.8% |
| Peruvians | 7.9 /100 | #221 | Tragic 88.8% |
| Uruguayans | 7.0 /100 | #222 | Tragic 88.8% |
| Immigrants | South America | 7.0 /100 | #223 | Tragic 88.8% |
| Immigrants | Hong Kong | 6.2 /100 | #224 | Tragic 88.7% |
| Cree | 6.0 /100 | #225 | Tragic 88.7% |
| Cheyenne | 5.7 /100 | #226 | Tragic 88.7% |
| Ute | 5.6 /100 | #227 | Tragic 88.7% |
| Immigrants | Norway | 5.5 /100 | #228 | Tragic 88.7% |
| Immigrants | Romania | 5.4 /100 | #229 | Tragic 88.7% |
Demographics Similar to Bermudans by 1 or more Vehicles in Household
In terms of 1 or more vehicles in household, the demographic groups most similar to Bermudans are Panamanian (87.5%, a difference of 0.010%), Immigrants from Africa (87.6%, a difference of 0.020%), Aleut (87.5%, a difference of 0.060%), Immigrants from Europe (87.6%, a difference of 0.070%), and Immigrants from Colombia (87.6%, a difference of 0.10%).
| Demographics | Rating | Rank | 1 or more Vehicles in Household |
| Immigrants | Liberia | 0.4 /100 | #264 | Tragic 87.8% |
| Africans | 0.4 /100 | #265 | Tragic 87.8% |
| Israelis | 0.3 /100 | #266 | Tragic 87.7% |
| Immigrants | Colombia | 0.3 /100 | #267 | Tragic 87.6% |
| Immigrants | Europe | 0.2 /100 | #268 | Tragic 87.6% |
| Immigrants | Africa | 0.2 /100 | #269 | Tragic 87.6% |
| Panamanians | 0.2 /100 | #270 | Tragic 87.5% |
| Bermudans | 0.2 /100 | #271 | Tragic 87.5% |
| Aleuts | 0.2 /100 | #272 | Tragic 87.5% |
| Immigrants | Northern Africa | 0.2 /100 | #273 | Tragic 87.4% |
| Immigrants | Morocco | 0.1 /100 | #274 | Tragic 87.4% |
| Immigrants | Singapore | 0.1 /100 | #275 | Tragic 87.2% |
| Immigrants | France | 0.1 /100 | #276 | Tragic 87.1% |
| Alsatians | 0.1 /100 | #277 | Tragic 87.1% |
| Immigrants | Southern Europe | 0.1 /100 | #278 | Tragic 87.1% |