Immigrants from Honduras vs Bermudan Ambulatory Disability
COMPARE
Immigrants from Honduras
Bermudan
Ambulatory Disability
Ambulatory Disability Comparison
Immigrants from Honduras
Bermudans
6.3%
AMBULATORY DISABILITY
7.6/ 100
METRIC RATING
223rd/ 347
METRIC RANK
6.5%
AMBULATORY DISABILITY
0.5/ 100
METRIC RATING
257th/ 347
METRIC RANK
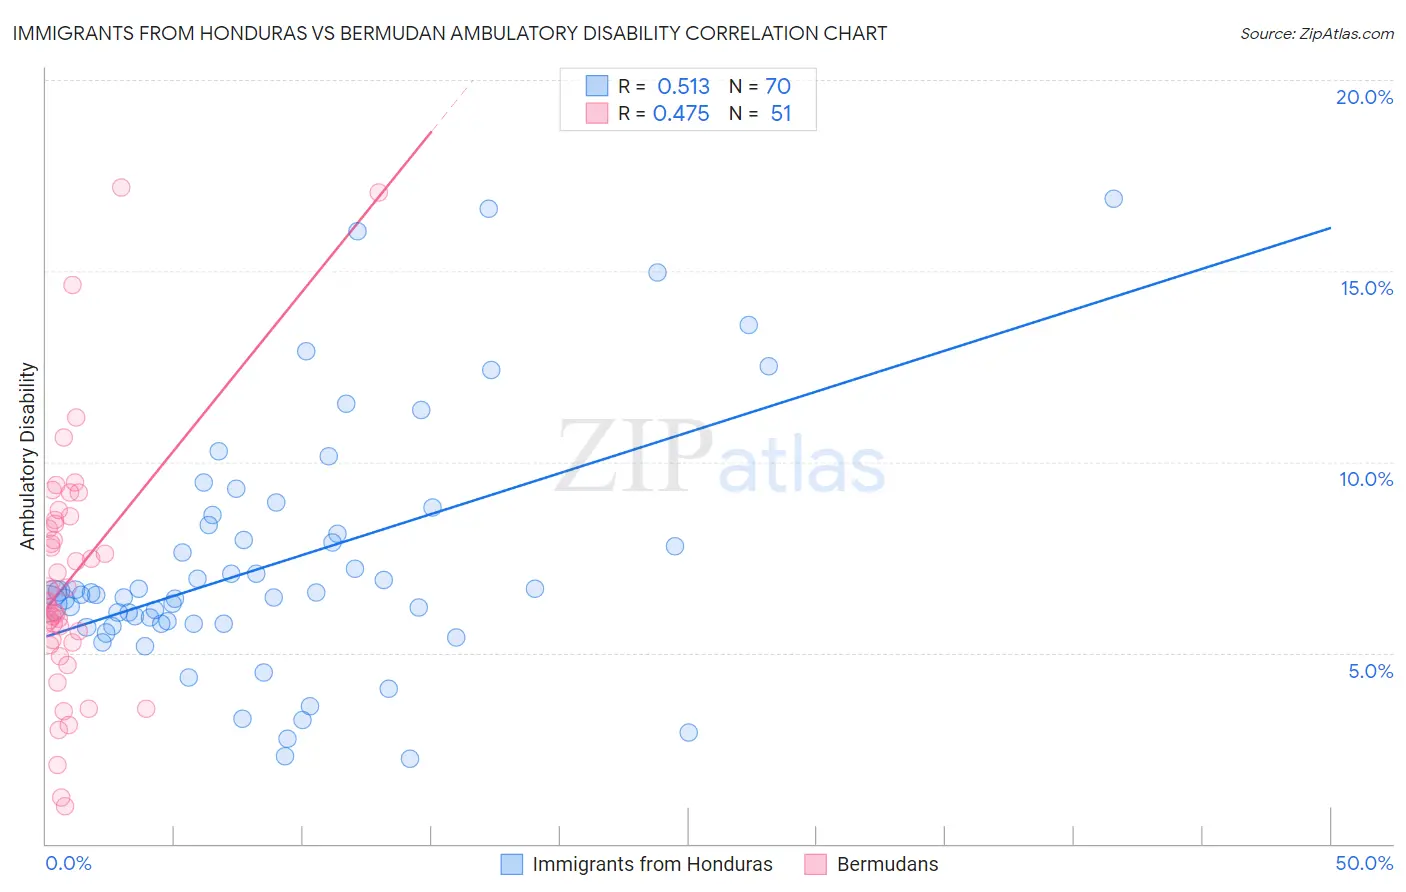
Immigrants from Honduras vs Bermudan Ambulatory Disability Correlation Chart
The statistical analysis conducted on geographies consisting of 322,545,499 people shows a substantial positive correlation between the proportion of Immigrants from Honduras and percentage of population with ambulatory disability in the United States with a correlation coefficient (R) of 0.513 and weighted average of 6.3%. Similarly, the statistical analysis conducted on geographies consisting of 55,721,081 people shows a moderate positive correlation between the proportion of Bermudans and percentage of population with ambulatory disability in the United States with a correlation coefficient (R) of 0.475 and weighted average of 6.5%, a difference of 3.5%.
Ambulatory Disability Correlation Summary
| Measurement | Immigrants from Honduras | Bermudan |
| Minimum | 2.2% | 0.98% |
| Maximum | 16.9% | 17.2% |
| Range | 14.6% | 16.2% |
| Mean | 7.4% | 7.0% |
| Median | 6.5% | 6.4% |
| Interquartile 25% (IQ1) | 5.8% | 5.3% |
| Interquartile 75% (IQ3) | 8.3% | 8.5% |
| Interquartile Range (IQR) | 2.6% | 3.2% |
| Standard Deviation (Sample) | 3.2% | 3.3% |
| Standard Deviation (Population) | 3.2% | 3.2% |
Similar Demographics by Ambulatory Disability
Demographics Similar to Immigrants from Honduras by Ambulatory Disability
In terms of ambulatory disability, the demographic groups most similar to Immigrants from Honduras are Liberian (6.3%, a difference of 0.10%), Honduran (6.3%, a difference of 0.27%), German Russian (6.3%, a difference of 0.29%), Hungarian (6.3%, a difference of 0.32%), and Immigrants from Albania (6.3%, a difference of 0.33%).
| Demographics | Rating | Rank | Ambulatory Disability |
| Canadians | 10.9 /100 | #216 | Poor 6.3% |
| Yugoslavians | 10.9 /100 | #217 | Poor 6.3% |
| Guamanians/Chamorros | 10.6 /100 | #218 | Poor 6.3% |
| Indonesians | 9.9 /100 | #219 | Tragic 6.3% |
| Immigrants | Albania | 9.6 /100 | #220 | Tragic 6.3% |
| Hungarians | 9.6 /100 | #221 | Tragic 6.3% |
| German Russians | 9.4 /100 | #222 | Tragic 6.3% |
| Immigrants | Honduras | 7.6 /100 | #223 | Tragic 6.3% |
| Liberians | 7.1 /100 | #224 | Tragic 6.3% |
| Hondurans | 6.3 /100 | #225 | Tragic 6.3% |
| Slavs | 5.1 /100 | #226 | Tragic 6.4% |
| Cubans | 4.0 /100 | #227 | Tragic 6.4% |
| Portuguese | 4.0 /100 | #228 | Tragic 6.4% |
| Czechoslovakians | 3.8 /100 | #229 | Tragic 6.4% |
| Mexicans | 3.5 /100 | #230 | Tragic 6.4% |
Demographics Similar to Bermudans by Ambulatory Disability
In terms of ambulatory disability, the demographic groups most similar to Bermudans are Immigrants from Uzbekistan (6.5%, a difference of 0.080%), Spanish American Indian (6.5%, a difference of 0.080%), Welsh (6.5%, a difference of 0.16%), Belizean (6.5%, a difference of 0.23%), and Aleut (6.6%, a difference of 0.26%).
| Demographics | Rating | Rank | Ambulatory Disability |
| Chinese | 1.0 /100 | #250 | Tragic 6.5% |
| Hawaiians | 0.9 /100 | #251 | Tragic 6.5% |
| Immigrants | Bahamas | 0.8 /100 | #252 | Tragic 6.5% |
| Scottish | 0.7 /100 | #253 | Tragic 6.5% |
| Belizeans | 0.7 /100 | #254 | Tragic 6.5% |
| Welsh | 0.6 /100 | #255 | Tragic 6.5% |
| Immigrants | Uzbekistan | 0.6 /100 | #256 | Tragic 6.5% |
| Bermudans | 0.5 /100 | #257 | Tragic 6.5% |
| Spanish American Indians | 0.5 /100 | #258 | Tragic 6.5% |
| Aleuts | 0.4 /100 | #259 | Tragic 6.6% |
| Immigrants | Belize | 0.4 /100 | #260 | Tragic 6.6% |
| Irish | 0.4 /100 | #261 | Tragic 6.6% |
| English | 0.4 /100 | #262 | Tragic 6.6% |
| Hmong | 0.3 /100 | #263 | Tragic 6.6% |
| Nepalese | 0.2 /100 | #264 | Tragic 6.6% |